HOW TO
Create percentage labels for pie charts
Summary
When using pie charts to symbolize data, labels with percentage values can be used to represent the percentage of each sector of the pie chart. Percentage labels are useful in identifying data patterns and they are linked to the percentage data in the attribute table. When edits are made to the percentage values in the attribute table, the labels are updated automatically.
This article provides instructions to create percentage labels for pie charts and it is suitable only when processing small data sets.
Procedure
Note:
Skip Step 1 if the percentage values for the pie chart have been calculated.
- Calculate the percentage of the data for the pie charts.
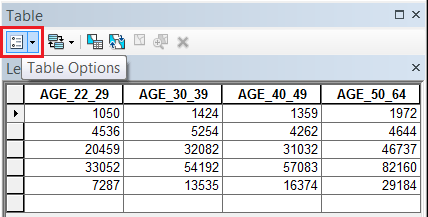
- In ArcMap, right-click the layer in the Table Of Contents, and click Open Attribute Table.
- In the Table window, click the Table Options drop-down arrow, and select Add Field.
- In the Add Field dialog box, type the field name, and select Float for the field type.
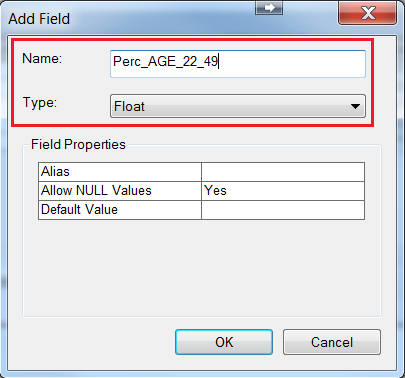
- Set other Field Properties as required, and click OK.
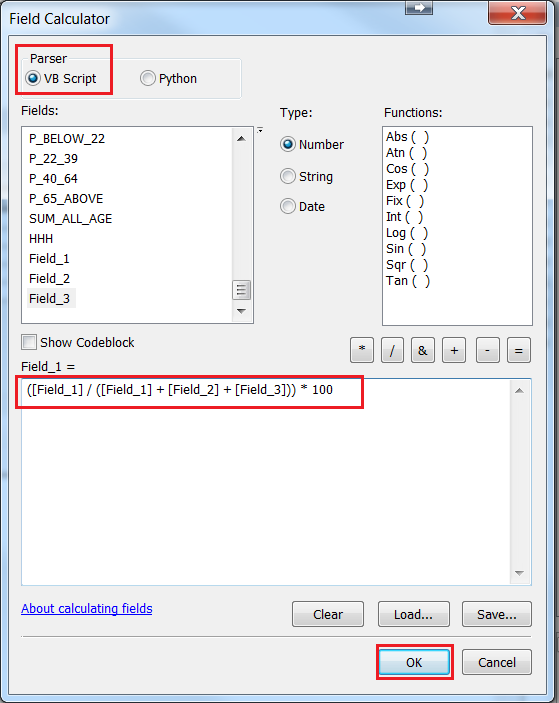
- In the attribute table, right-click the field header of the new field, and click Field Calculator.
- Select VB Script for Parser.
- Type the following expression in the code block box. Replace Field_1, Field_2, and Field_3 with the actual field names.
([Field_1] / ([Field_1] + [Field_2] + [Field_3])) * 100
- Create the pie charts for the calculated percentage values. For steps, refer to ArcMap: Using pie charts.
- Create percentage labels for the first sectors of the pie charts.
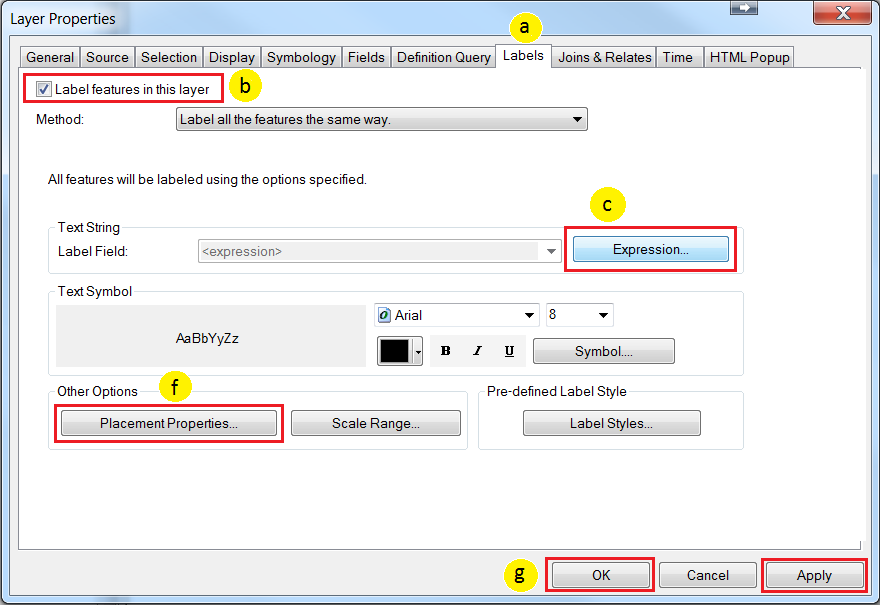
- In the Table Of Contents, right-click the layer and click Properties > Labels.
- Enable the Label features in this layer check box.
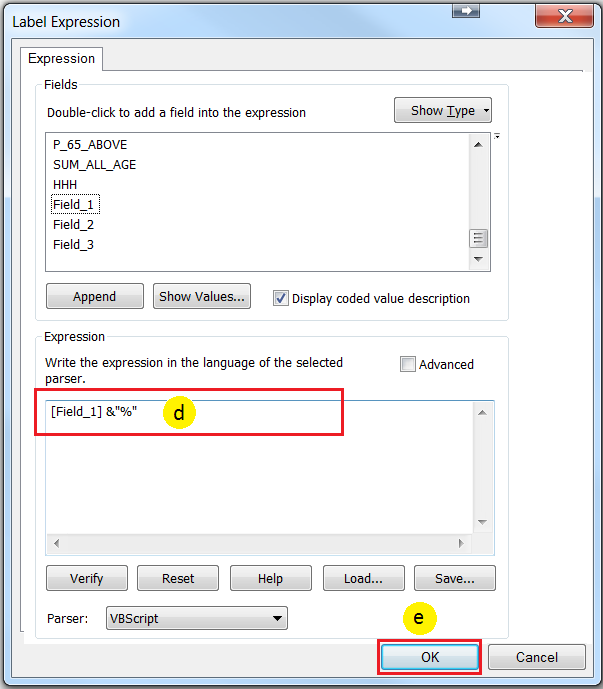
- Click the Expression button.
- In the Label Expression dialog box, type the following expression in the Expression box. Replace Field_1 with the actual field name.
[Field_1]&"%"
- Click OK to close the Label Expression dialog box and display the Layer Properties dialog box.
- Click the Placement Properties button in the Other Properties section to set other properties,.
- Click Apply and OK to display the labels for the first sectors of the pie charts.
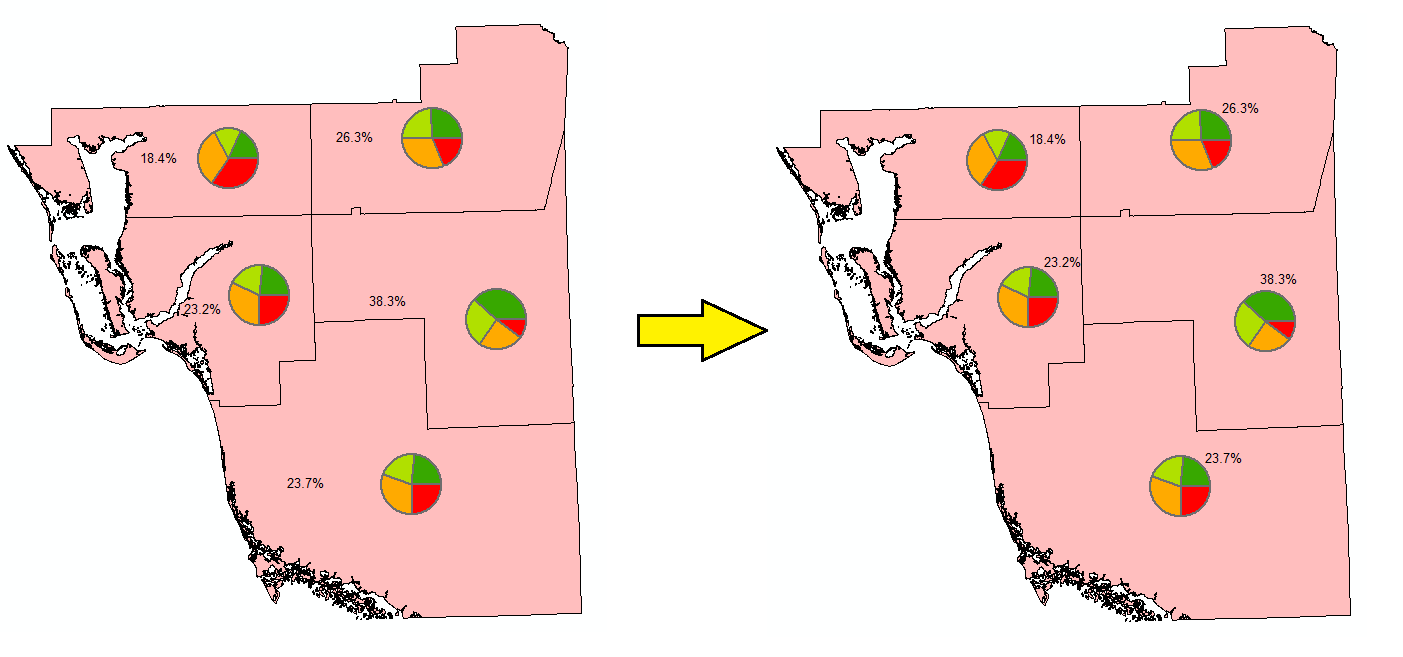
- Convert the percentage labels to annotation classes to allow the positions of the percentage values to be adjusted. For steps, refer to ArcMap: Converting labels to annotation features. After converting the labels, a new annotation feature class for the field is automatically added.
Note:
The ability to convert labels to annotation features is limited to ArcGIS Desktop Standard and Advanced users only.
To edit the annotation feature class position:
- Right-click the annotation feature class in Table Of Contents, and click Edit features > Start Editing.
- On the map, select the first annotation class to be repositioned.
- Hold and drag the annotation class to move the annotation.
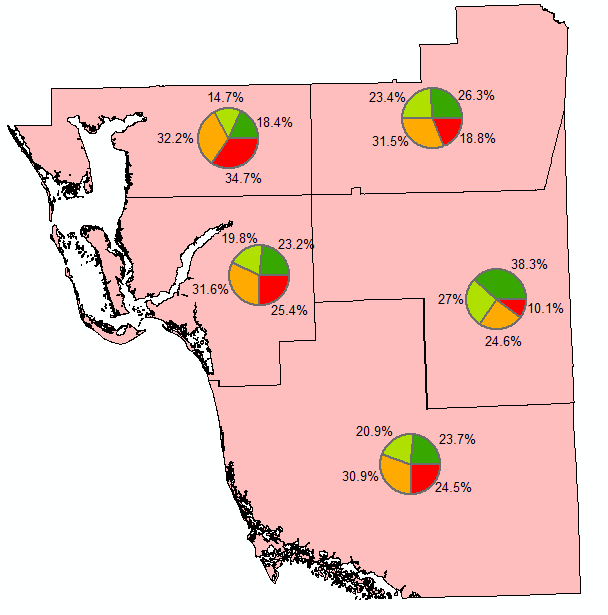
- Repeat Steps 3 and 4 for the remaining percentage fields of the attribute table.
Article ID: 000014788
- ArcMap
Get support with AI
Resolve your issue quickly with the Esri Support AI Chatbot.


Related Information
Discover more on this topic
Search for related information
Find training related to this topic
Explore ideas and give feedback
Get help from ArcGIS experts
Start chatting now