PROBLEM
Filters applied to the ArcGIS Online web map do not reflect in the map legend
Description
In ArcGIS Online, filters applied to the web map are not reflected in the map legend.
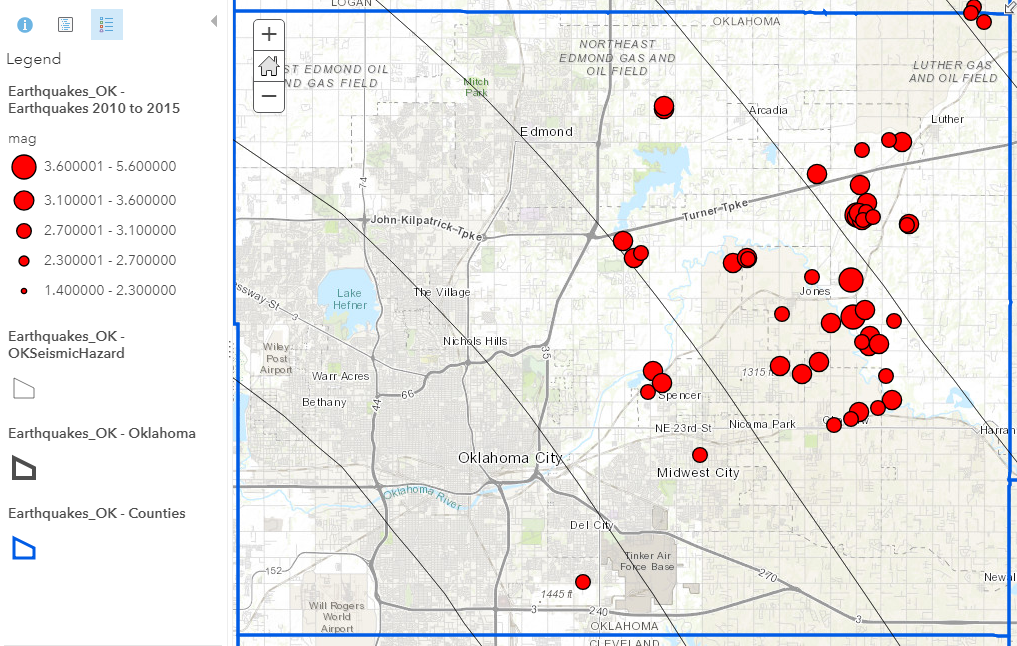
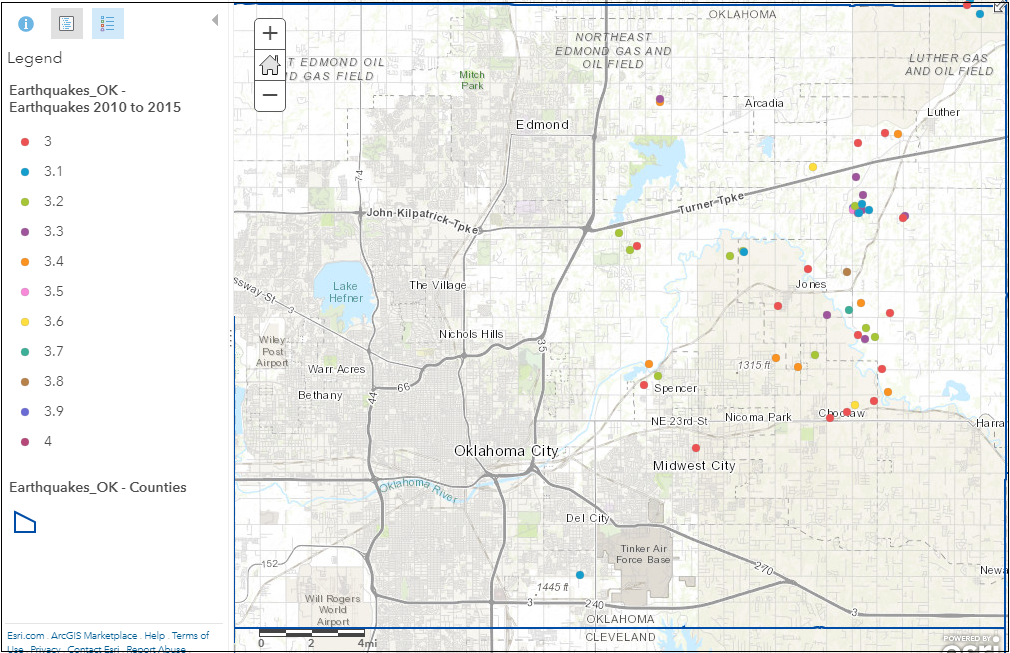
The image below shows the occurrence of earthquakes in an Oklahoma county ranging from a magnitude of 1.4 to 5.6. The drawing style uses the Counts and Amounts (Size) symbology.

After the filter is applied to include earthquakes of a magnitude of 3.0 to 4.0, the map legend still shows earthquakes of a magnitude of 1.4 to 5.6 although the data in the map viewer honors the filter criteria.
Cause
This is a known limitation in ArcGIS Online.
Solution or Workaround
Follow the instructions below to ensure the map legend in ArcGIS Online displays according to the filter criteria:
- After applying the filter, click the Change Style icon
 to open the Change Style pane.
 - In the Change Style pane, specify the Choose an attribute to show field from the drop-down menu, and select Types (Unique symbols) as the new symbology type.
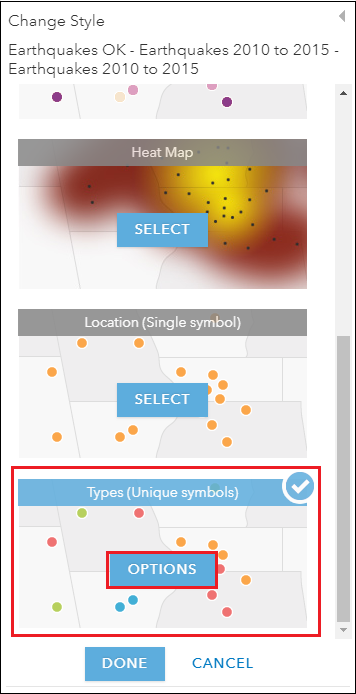
- Click OPTIONS.
- Reorganize the data in the Click to edit symbol or label section by grouping the data to be excluded from the map legend into the Other category.
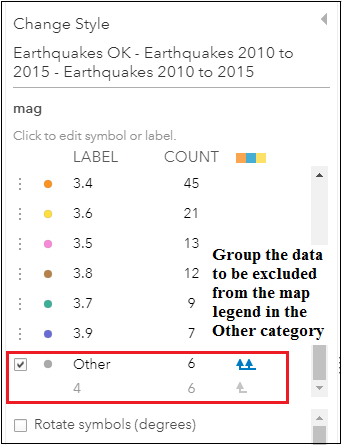
Note: Below are some suggestions to reorganize the data in the Click to edit symbol or label section: • Move the data to be excluded from the map legend into the Other category. • Move the data to be included in the map legend from the Other category by clicking the Move all values out button. • Move only selected data from the Other category by clicking the Move value out button
of each data. • If necessary, rearrange the position of the data based on the LABEL value. By default, data are arranged in descending order of the COUNT value. The position of items in the map legend is based on the LABEL value.
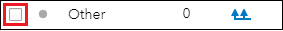
- Uncheck the Other check box to exclude the values in the Other category from the map legend.
- Click OK > DONE.
The image below displays only the filtered data (earthquakes ranging from a magnitude of 3.0 to 4.0) in the map legend and in the map viewer based on the Types (Unique symbols) symbology.
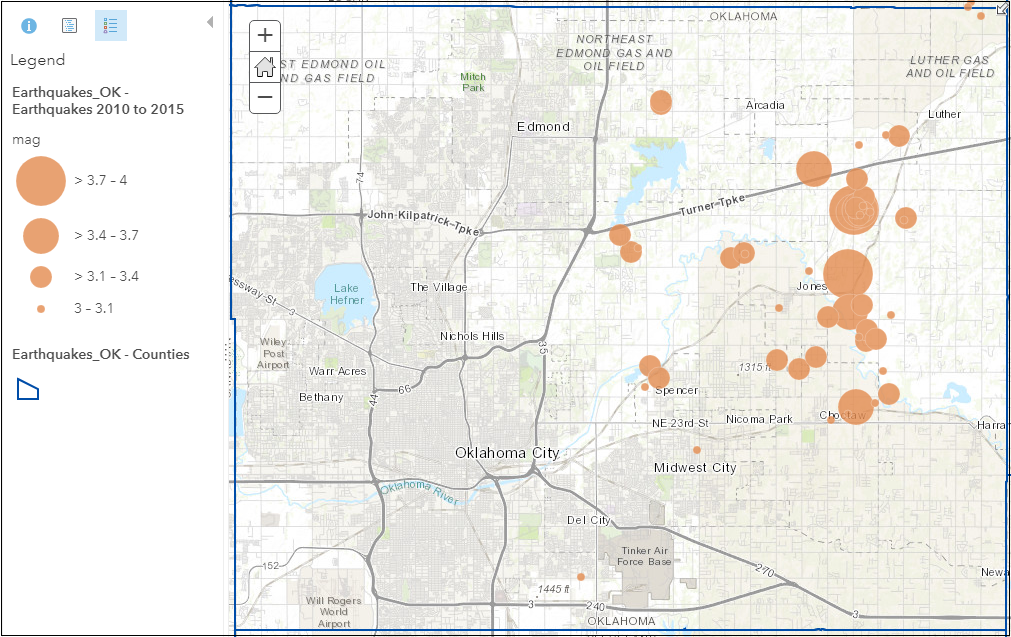
Note: To represent the data in a range of values, select the Counts and Amounts (Size) option, and check the Classify Data check box. For more information on different types of symbology, refer to ArcGIS Online: Style numbers.The image below shows the filtered data in the map legend and in the map viewer based on the Counts and Amounts (Size) symbology.
Article ID: 000018883
- ArcGIS Online
Get support with AI
Resolve your issue quickly with the Esri Support AI Chatbot.


Related Information
Discover more on this topic
Search for related information
Find training related to this topic
Explore ideas and give feedback
Get help from ArcGIS experts
Start chatting now