HOW TO
Create an NDVI map in ArcGIS Pro
Summary
The Normalized Difference Vegetation Index (NDVI) is a standardized index that allows users to generate an image displaying greenness, also known as relative biomass. NDVI uses red and near infrared (NIR) light properties to quantify vegetation, and this can be useful in classifying high and low vegetation, and indicating drought.
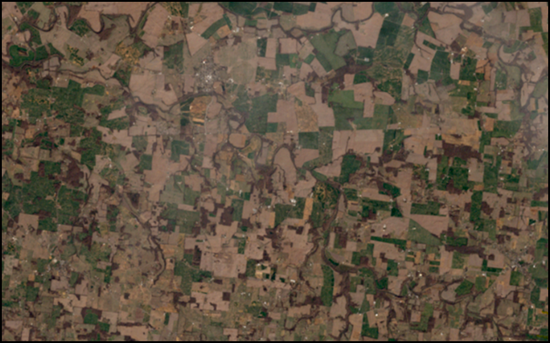
In ArcGIS Pro, NDVI maps can be created from imagery with red and NIR bands such as Sentinel-2 and Landsat satellite imagery data. This article provides two workflows to create an NDVI map, using the NDVI raster function, and the Composite Bands tool, with Landsat 7 imagery (as shown below).
Procedure
Using the NDVI raster function
If a multiband raster is present, use the NDVI raster function to convert the raster to NDVI.
- Open the ArcGIS Pro project.
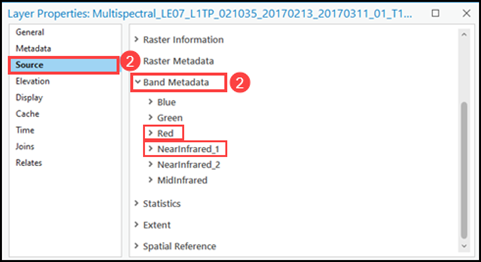
- Right-click the multiband raster layer in the Contents pane and navigate to Properties > Source > Band Metadata.
- Take note of the red and near infrared spectral band numbers in the Band Metadata section. In this example, Red is in the third band (band 3), and NearInfrared_1 is in the fourth band (band 4).
- Click Close to close the Layer Properties window.
- Use the NDVI function to calculate the NDVI values using the red and near infrared bands.
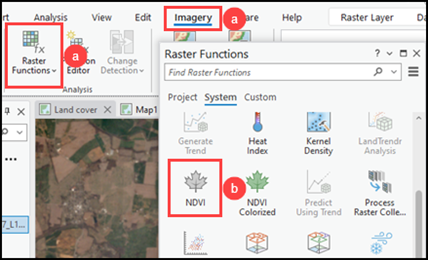
- On the ArcGIS Pro ribbon, click the Imagery tab. In the Analysis group, click Raster Functions.
- In the Raster Functions pane, click NDVI.
Note:
Choose the NDVI Colorized function for a colored output raster. Refer to ArcGIS Pro: NDVI Colorized function for more information.
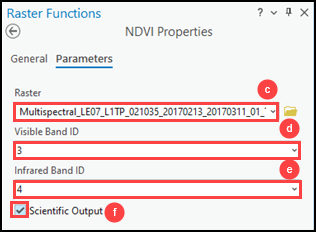
- In the NDVI Properties pane, select the multiband raster layer for Raster.
- Select the red spectral band number identified in Step 3 for Visible Band ID. In this example, 3 is selected.
- Select the near infrared spectral band number identified in Step 3 for Infrared Band ID. In this example, 4 is selected.
- Check the Scientific Output check box and click Create new layer.
The output raster displays NDVI values ranging from -1 to 1 on the map.
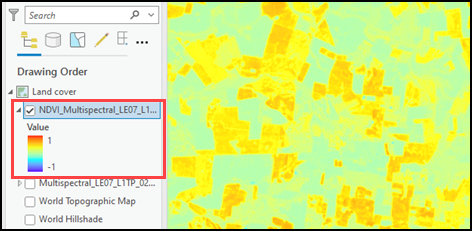
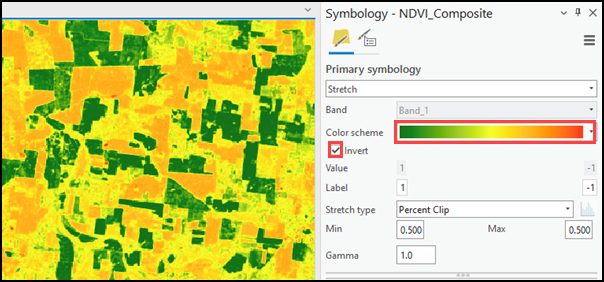
- Change the NDVI layer’s color scheme to clearly distinguish the vegetation density.
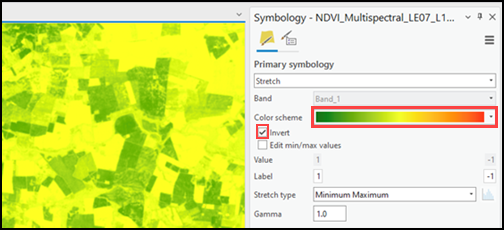
- Right-click the NDVI layer in the Contents pane and click Symbology.
- In the Symbology pane, select a suitable color scheme for Color scheme. In this example, the Condition Number color scheme is selected to display colors from green to red. Check the Invert check box to invert the colors if necessary.
Using the Composite Bands tool
If there are individual spectral band rasters, use the Composite Bands tool to merge multiple bands before converting the raster to NDVI.
- Open the ArcGIS Pro project.
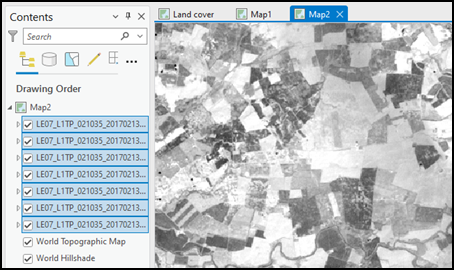
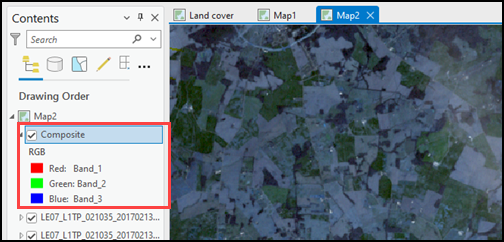
- Select the individual spectral band rasters in the Contents pane. In this example, the rasters for Landsat 7, bands one to seven, are selected.
Note:
Press the Ctrl key and click the items to select multiple items.
- Click the Imagery tab on the ArcGIS Pro ribbon. In the Tools group, click the Process drop-down and select Composite.
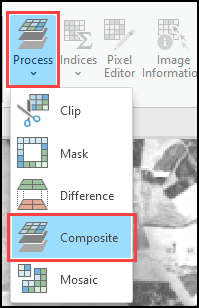
The output is a single raster merged from the single-band datasets. The bands are combined to display the data as a color composite.
- Use the NDVI tool to convert the color composite raster to NDVI.
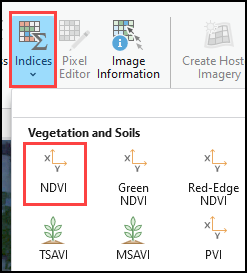
- On the ArcGIS Pro ribbon, click the Indices drop-down and select NDVI.
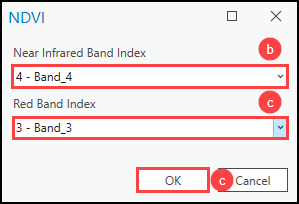
- In the NDVI window, select the near infrared spectral band for Near Infrared Band Index.
- Select the red spectral band for Red Band Index and click OK.
Note:
In this example, Landsat 7 satellite imagery data is used. Refer to ArcGIS Blog: Band Combinations for Landsat 8 for more information on the spectral band designations of Landsat 7 and Landsat 8.
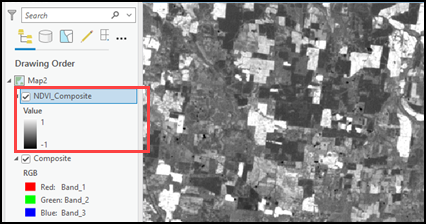
The output raster displays NDVI values ranging from -1 to 1 on the map.
- Change the NDVI layer’s color scheme to clearly distinguish the vegetation density.
- Right-click the NDVI layer in the Contents pane and click Symbology.
- In the Symbology pane, select a suitable color scheme for Color scheme. In this example, the Condition Number color scheme is selected to display colors from green to red. Check the Invert check box to invert the colors if necessary.
Article ID: 000030690
- ArcGIS Pro 3 1
- ArcGIS Pro 3 0
- ArcGIS Pro 2 9x
Get support with AI
Resolve your issue quickly with the Esri Support AI Chatbot.


Related Information
Discover more on this topic
Search for related information
Find training related to this topic
Explore ideas and give feedback
Get help from ArcGIS experts
Start chatting now