操作方法
操作方法:在 ArcGIS Pro 中使用波段算术公式计算多颗卫星影像的 NDVI
描述
归一化差值植被指数 (NDVI) 是一种用于植被分析的方法,用于评估土地随时间的退化、绿色生物量或植被健康状况。 该指数是通过比较红色波段叶绿素色素的吸收和近红外波段植物材料的高反射率来确定的,这些反射率是卫星或无人机等遥感仪器捕获的。 在 ArcGIS Pro 中,波段算术函数支持使用波段算术公式计算 NDVI。 该方法创建了一个新的输出波段,允许从光谱属性中提取重要信息以进行深入分析或可视化。 本文提供的工作流涉及从 Sentinel-2 Level-2A 卫星影像的各个波段创建多波段栅格,如下图所示。
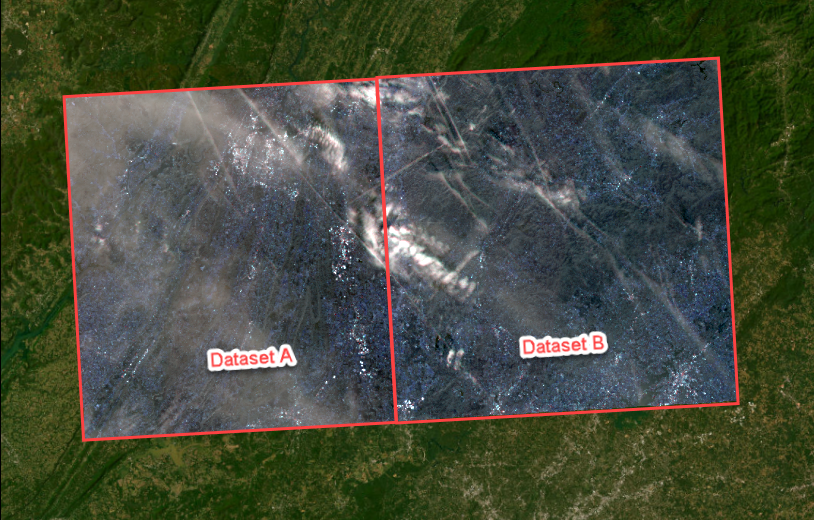
然后对多波段栅格进行镶嵌处理,并用作输入,以使用 Sentinel-2 Level-2A 卫星影像的特定波段算术公式计算 NDVI。
解决方案或解决方法
Note:
Individual files of bands are used to represent different types of satellite imagery. For example, the Sentinel-2 Level-2A satellite imagery includes a Multi-Spectral Instrument (MSI) with 13 spectral bands and pixel resolutions ranging from 10 to 60 meters. Refer to ArcGIS Pro: Sentinel-2 for more information. To enhance data visualization and interpretation, the imagery bands must be combined into a single raster dataset containing multiple bands prior to mosaicking. The band combination is determined by the analysis objectives and the characteristics of the target area.
- 在 ArcGIS Pro 中打开工程。
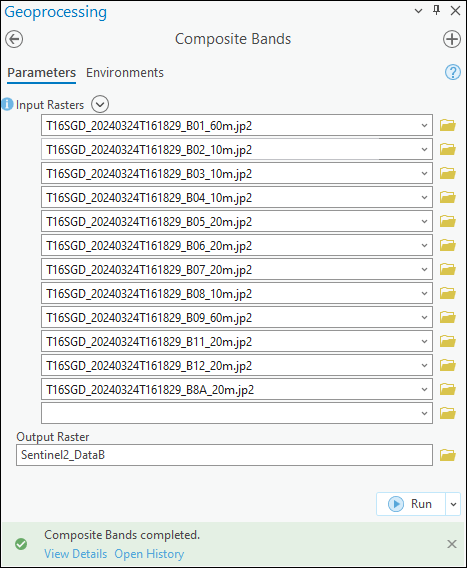
- 根据卫星影像的各个波段创建多波段栅格。 有关说明,请参阅在 ArcGIS Pro 中根据卫星影像的各个波段创建多波段栅格。 在本例中,使用复合波段工具创建两个名为 Sentinel2_DataA 和 Sentinel2_DataB 的多波段栅格。
- 在视图选项卡的窗口组中,单击目录窗格。
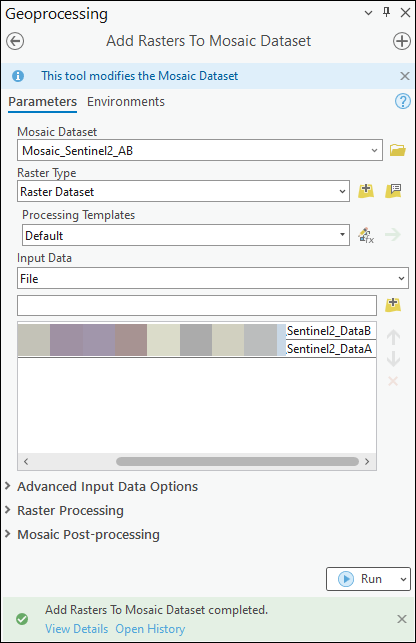
- 创建镶嵌数据集,并将在步骤 2 中创建的多波段栅格添加到其中。 在本例中,将创建名为 Mosaic_Sentinel2_AB 的镶嵌数据集。
Note:
In ArcGIS Pro, the Band Arithmetic function can only perform an arithmetic operation on a single raster layer at a time, which is a known limitation. However, mosaicking multiple raster datasets into a single raster dataset allows the NDVI of the imagery to be calculated across the entire dataset.
- 使用波段算术公式计算影像的 NDVI。
Note:
Satellite imagery includes bands representing different wavelengths of the electromagnetic spectrum, ranging from ultraviolet to visible, near infrared, and shortwave infrared. Refer to ArcGIS Pro: Raster bands for more information. Ensure the band arithmetic formula includes the correct band combination for the imagery before calculating the NDVI.
- 在影像选项卡的分析组中,单击栅格函数。
- 在栅格函数窗格的数学下,单击波段算术。
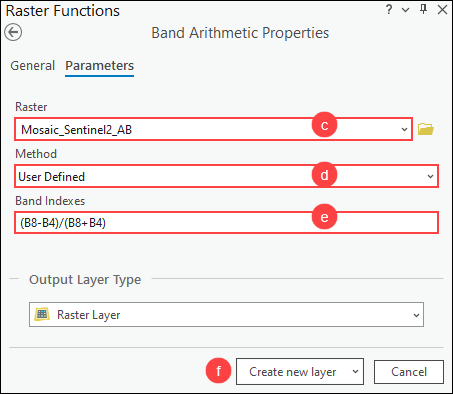
- 在波段算术属性窗格中,对于栅格,从下拉列表中选择在步骤 4 中创建的镶嵌数据集。
- 对于方法,从下拉列表中选择用户定义。
- 对于波段索引,复制以下 NDVI 的波段算术公式并将其粘贴到波段索引框中。 将 <NIR> 替换为首选的近红外波段,将 <Red> 替换为影像的红色波段。 在本例中,B8(波段 8)表示近红外波段,B4(波段 4)表示 Sentinel-2 Level-2A 卫星图像的红色波段。
(<NIR>-<Red>)/(<NIR>+<Red>)
- 单击新建图层。
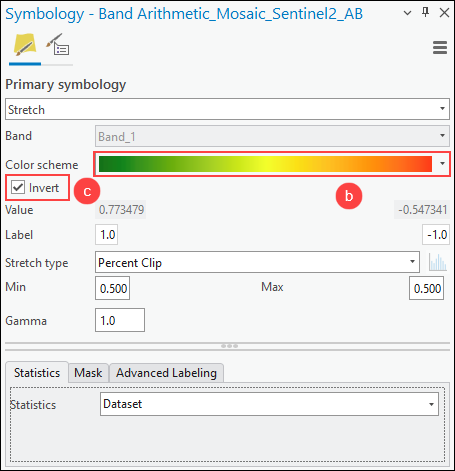
- 更改 NDVI 图层的配色方案以清楚地区分植被密度。
- 在内容窗格中,右键单击 NDVI 图层,然后单击符号系统。
- 在符号系统窗格中,对于配色方案,从下拉列表中选择首选配色方案。 在此示例中,选择条件数配色方案以显示从绿色到红色的颜色。 如有必要,选中显示名称复选框以显示所有配色方案的描述性名称。
- 如有必要,选中反转复选框以反转颜色。
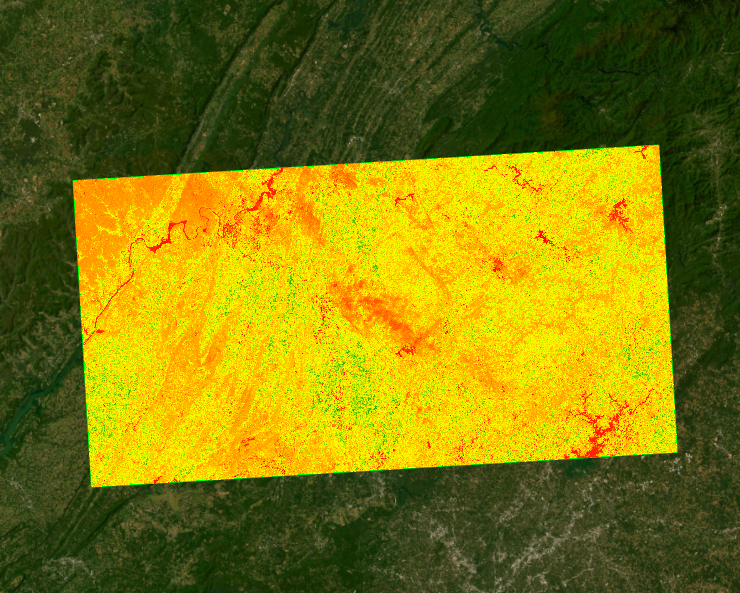
下图显示了使用 ArcGIS Pro 中的波段算术公式计算的多个 Sentinel-2 影像的 NDVI。 NDVI 值(内容窗格中的栅格图层下方)范围为 -1 至 1,值越高表示植被越健康、越丰富。
文章 ID: 000032331
获得人工智能支持
使用 Esri Support AI Chatbot 快速解决您的问题。


相关信息
发现关于本主题的更多内容
Search for related information
Find training related to this topic
Explore ideas and give feedback
获取来自 ArcGIS 专家的帮助
立即开始聊天