HOW TO
Display overlapping 3D points in ArcGIS Pro
Summary
In ArcGIS Pro, 3D points can be extruded based on attributes to create columns of different lengths to represent variability in the data. In some instances, these points are overlapped on top of each other (for example, point features with materials and depths data collected from boreholes) and must be visualized in a way that displays each column with its respective length. To do this, the point data must have elevation and extrusion attributes.
The image below shows borehole attributes containing elevation, extrusion, and material data. In this article, the borehole point features are extruded to 3D columns based on the Extrusion field using the Absolute Height extrusion type.

Procedure
The instructions provided describe how to display overlapping 3D points in ArcGIS Pro.
- Add the point feature class to an ArcGIS Pro project. Refer to Add data to a project for steps to do this.
- Convert the map to either a global or local scene. Refer to Convert a map to a scene for steps to do this.
- In the Contents pane, drag the point feature class to the 3D Layers group.
- Set the elevation properties for the point feature class.
- In the Contents pane, right-click the point feature class, and click Properties.
- In the Layer Properties dialog box, click Elevation, and select Features are At an absolute height.
- Select the A field option, and select the field containing the point elevation values from the drop-down list.
- Select the desired unit for Elevation units.
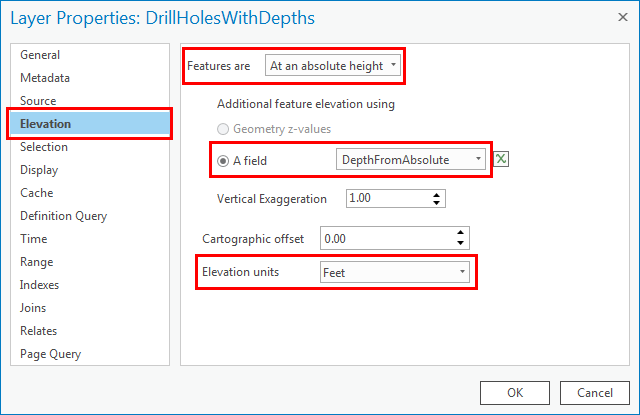
- Click OK.
- Set the extrusion properties for the point feature class to visualize the column length of each overlapping 3D point.
- Click the point feature class in the Contents pane, and click the Appearance tab.
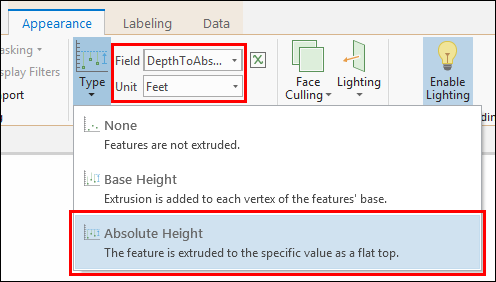
- In the Extrusion group, click the drop-down arrow for Type, and select Absolute Height. Refer to Extrude features to 3D symbology for more information on extrusion type.
- In the Field drop-down list, select the field containing the extrusion values to extrude the 3D points.
- In the Unit drop-down list, select the desired unit.
- Change the symbology of the extruded 3D points as desired. Refer to Attribute-driven symbology for more information.
- On the Appearance tab, in the Drawing group, click the Symbology icon. The Symbology pane is opened.
- Select the desired symbology type for Primary symbology.
- Select a field on which to symbolize.
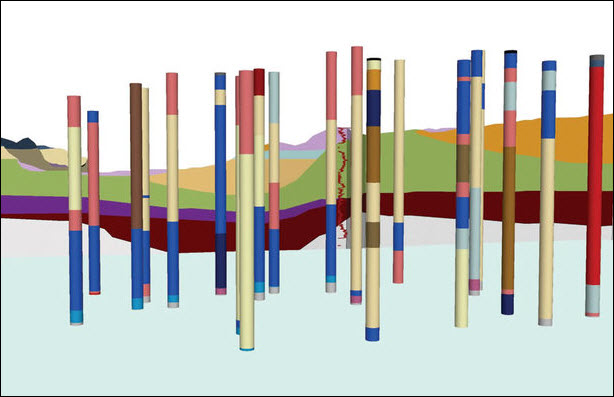
The image below shows overlapping 3D points displaying different material types of boreholes based on the unique values symbology.
Article ID: 000021785
- ArcGIS Pro 2 x
Get support with AI
Resolve your issue quickly with the Esri Support AI Chatbot.


Related Information
Discover more on this topic
Search for related information
Find training related to this topic
Explore ideas and give feedback
Get help from ArcGIS experts
Start chatting now