A to Z GIS | Explore this related guide, featuring updated terms and graphics and developed in coordination with Esri’s GIS Dictionary team.
Learn more about A to Z GIS
GIS Dictionary
Browse dictionary
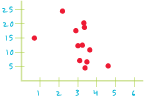
scatter chart
URL copiedShare URL
[spatial analysis]
A chart or graph in which the relation between two variables is shown with increasing values scaled along perpendicular x- and y-axes. Scatter charts are frequently used in analysis to find data trends. Commonly known as a scatterplot.