操作方法
操作方法:创建信息图表样式汇总报表
摘要
Starting at ArcGIS Pro version 2.7, the Summary Reports tool can create infographic-style summary reports. Infographics are newer-style reports, displaying information using compelling graphics and charts, while summary reports are more tabular-styled reports.
The infographic report templates are available for local data after installing the USA 2020 data patch.
过程
Download and install the USA 2020 data patch
- Log in with an ArcGIS account, and download the USA 2020 data patch.
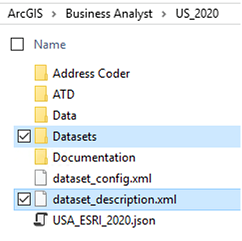
- Unzip the USA 2020 data patch. The patch contains one folder and one XML file:
- Datasets folder
- dataset_description.xml
- Copy and paste the contents of the patch to your US 2020 data location:
<install path>\ArcGIS\Business Analyst\US_2020
- Delete the Business Analyst cache located in your user profile:
C:\Users\<user name>\AppData\Local\ESRI\Business Analyst
- Open ArcGIS Pro and set the data source to USA_ESRI_2020.
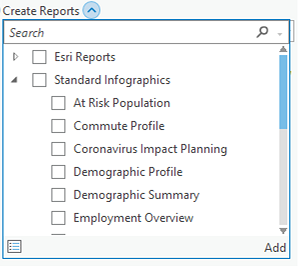
- Open the Summary Report geoprocessing tool.
- Select one of the the Standard Infographics report templates.
These are now available, in addition to standard Esri Reports
文章 ID: 000025234
获得人工智能支持
使用 Esri Support AI Chatbot 快速解决您的问题。


相关信息
发现关于本主题的更多内容
Search for related information
Find training related to this topic
Explore ideas and give feedback
获取来自 ArcGIS 专家的帮助
立即开始聊天