CÓMO
Mostrar varios gráficos con recuentos dinámicos al seleccionar entidades en Web AppBuilder for ArcGIS
Resumen
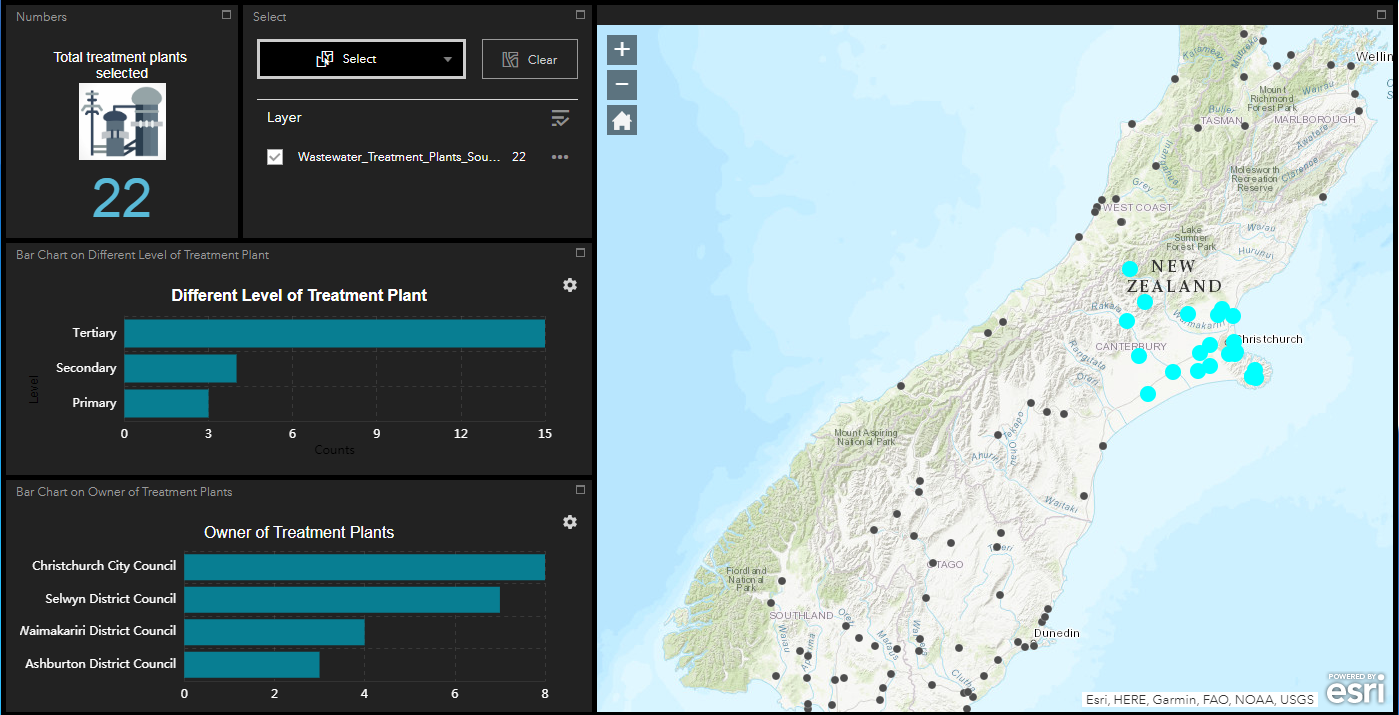
Displaying multiple charts with current feature counts when a feature is selected is important to analyze multiple attributes simultaneously from a subset of data. This enables relationship studies between multiple attributes and potentially saves time in the decision-making process. In this example, treatment plants in South Island, New Zealand are selected and feature counts of different levels of treatment plants and the owners of these plants are dynamically displayed.
Procedimiento
To create an ArcGIS Web AppBuilder app that displays multiple charts and is updated when features are selected, configure Infographic and Select widgets that reference the same layer.
- In ArcGIS Web AppBuilder, select the appropriate theme to display multiple charts. In this example, Dashboard Theme is selected.
- Click the Widget tab, and add the Infographic widget
 . Configure as follows:
- In the Choose a template window, select a chart template and click OK. In this example, Bar is selected.
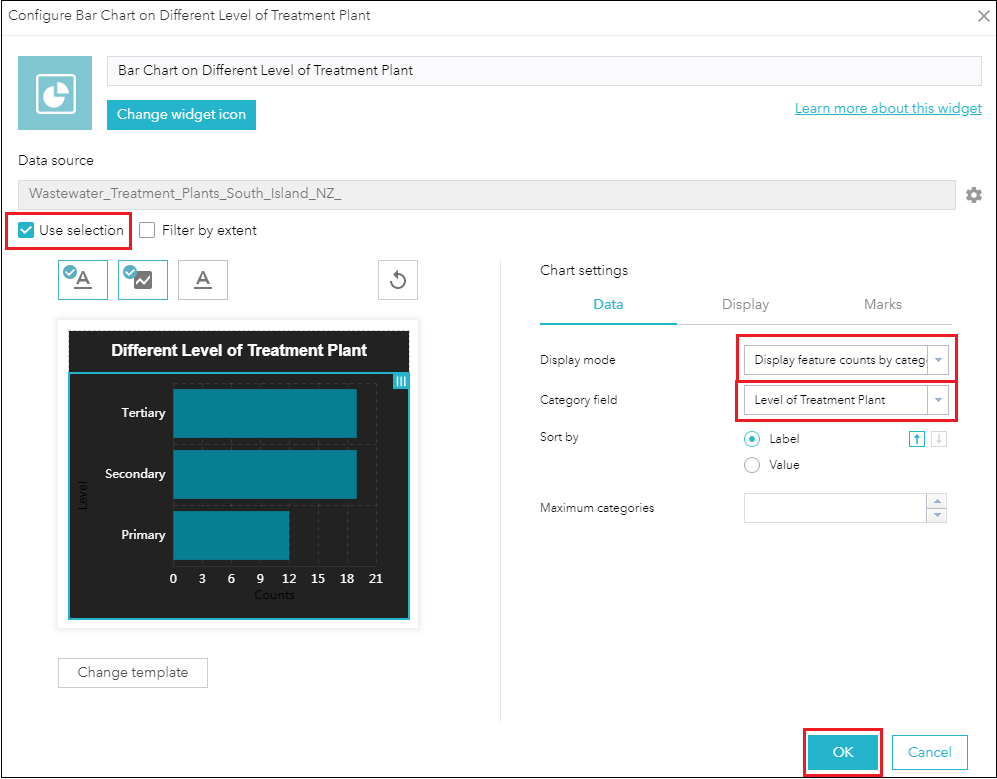
- In the Set data source window, specify the layer of interest and click OK. In this example, Wastewater_Treatment_Plants_South_Island_NZ_ is selected.
- Ensure the Use selection option is checked.
Note:
Displaying charts based on feature selection is not available in the Chart widget.
- Click the chart area to open the Chart settings section.
- On the Data tab of the Chart Settings section, select Display feature counts by category for the Display mode field.
- For Category field, select the attribute on which the feature counts are based. In this example, Level of Treatment Plant is selected.
- Make changes, if any, to the chart title, axes, and display properties.
- Click OK.
- Repeat Step 2 to configure more charts.
- On the Widget tab, add and configure the Select widget
 . In the Choose which layers are available to selected field, select the same layer selected in Step 2b. In this example, Wastewater_Treatment_Plants_South_Island_NZ_ is selected.
Selecting certain features on the map updates feature counts on multiple charts dynamically.
Id. de artículo: 000022687
Obtenga soporte con IA
Resuelva su problema rápidamente con el chatbot de inteligencia artificial de soporte de Esri.


Información relacionada
Descubrir más sobre este tema
Search for related information
Find training related to this topic
Explore ideas and give feedback
Obtener ayuda de expertos en ArcGIS
Empieza a chatear ahora