HOW TO
Create a color-coded map for a specific geographic area in the Business Analyst Web App
Summary
A color-coded map created in the Business Analyst Web App (BA Web App) provides information about an area of interest for business analysis, such as the density pattern of the median household income class, the consumer spending patterns for marketing analysis, and so forth. When creating a color-coded map in the BA Web App, the display extent of the map is set to the default current map extent, which creates a color-coded map for the entirety of the displayed map extent.
In some instances, a color-coded map must be created for a specific geographic area to provide information for the specific area (for example, a state, region, or city). However, the BA Web App interface does not provide the option to filter the color-coded map to a specific area without first defining a study area.
Procedure
The instructions provided describe how to create a color-coded map for a specific geographic area in the Business Analyst Web App.- Define the study area to be the extent limit of the color-coded map.
- Launch Business Analyst Online and open a project.
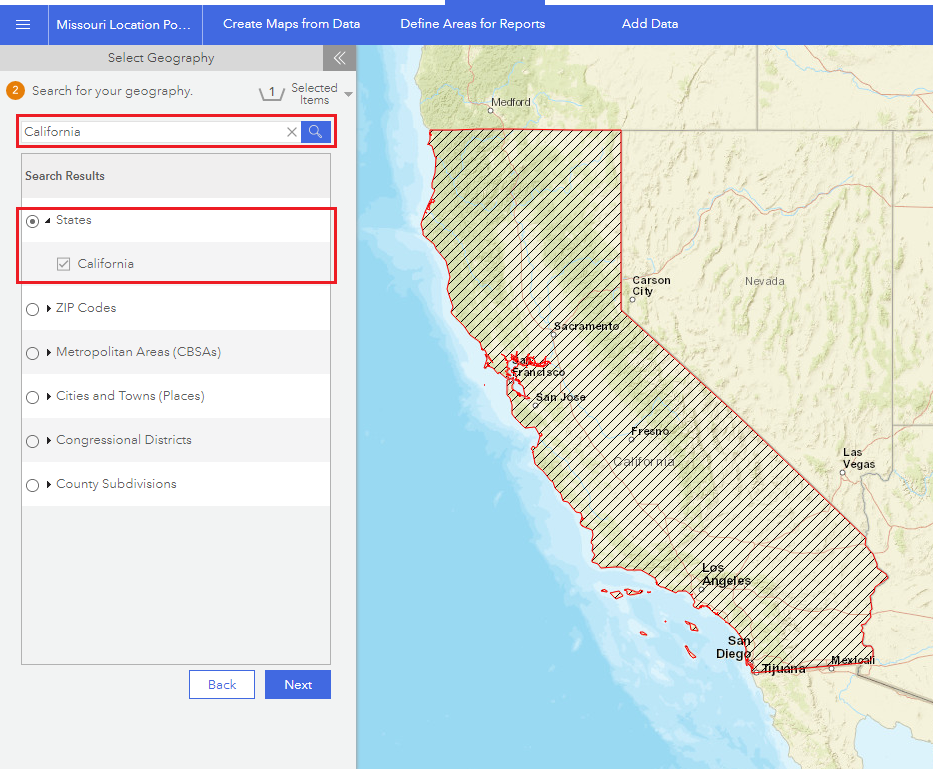
- Click the Maps tab > Define Areas for Reports > Select Geography.
- In the Select Geography pane on the left, select a method to search for the study area from the provided options (Search, Select from Map, and Select from Full List). Refer to the following document for more information on how to use the three geography selection method, Business Analyst Web App: Select geography.
For example, use the Search method to search for the study area by typing the keyword such as the city name, county, ZIP Code or area name in the Search box.
- Create the color-coded map for the selected study area.
- Click the Create Maps from Data tab > Color-Coded Maps.
- In the Color-Coded Maps pane, select the variable to map.
- The current default display extent of the color-coded map is Current map extent. To filter the color-coded map to the study area, click the drop-down arrow next to Current map extent, and select the study area defined in Step 1.
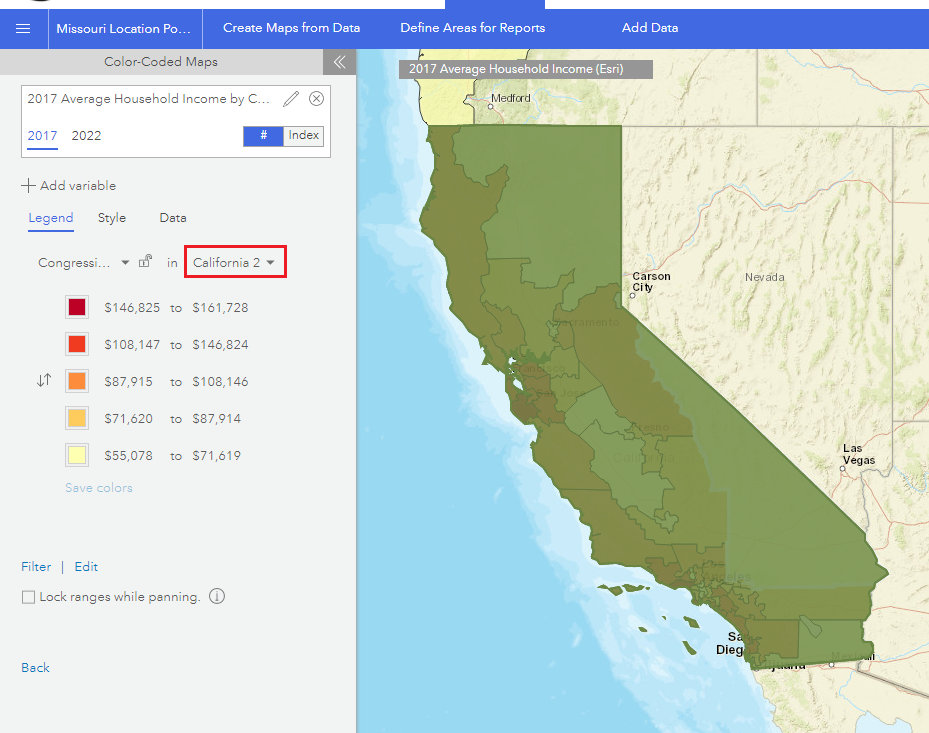
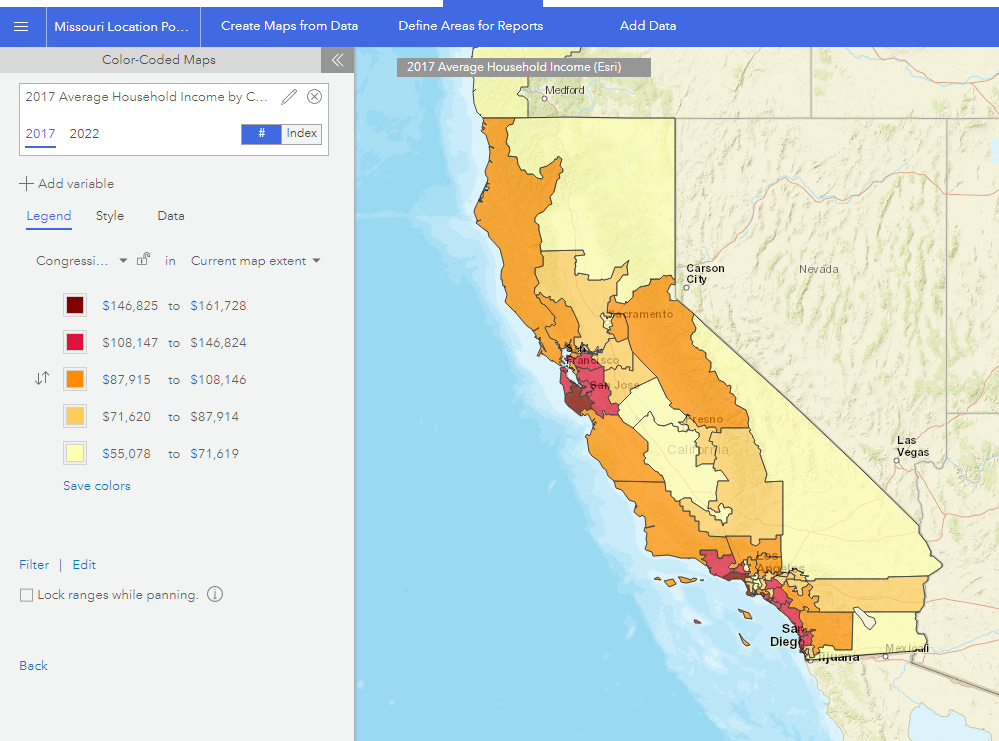
A color-coded map is created covering the extent of the study area.
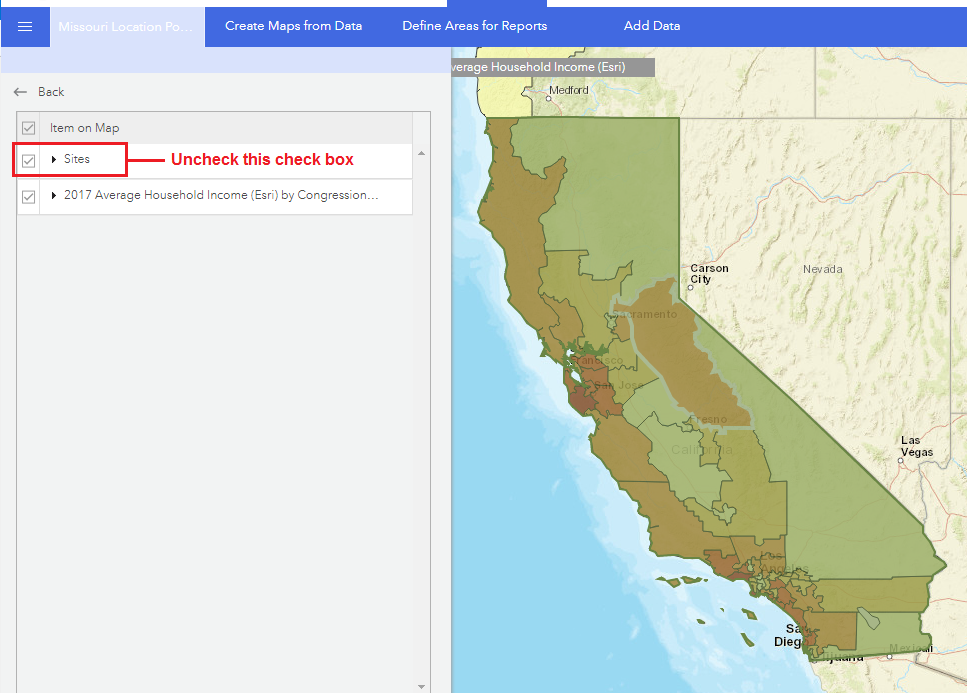
- In the example shown, to turn off the colored layer of the study area displayed over the top of the color-coded map, click the Map legend
 button in the Tool palette on the right side of the map, and uncheck Sites.
Article ID: 000013912
- ArcGIS Business Analyst Web App
Get support with AI
Resolve your issue quickly with the Esri Support AI Chatbot.


Related Information
Discover more on this topic
Search for related information
Find training related to this topic
Explore ideas and give feedback
Get help from ArcGIS experts
Start chatting now