HOW TO
Create Infographic Style Summary Reports
Summary
Starting at ArcGIS Pro version 2.7, the Summary Reports tool can create infographic-style summary reports. Infographics are newer-style reports, displaying information using compelling graphics and charts, while summary reports are more tabular-styled reports.
The infographic report templates are available for local data after installing the USA 2020 data patch.
Procedure
Download and install the USA 2020 data patch
- Log in with an ArcGIS account, and download the USA 2020 data patch.
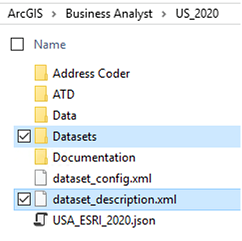
- Unzip the USA 2020 data patch. The patch contains one folder and one XML file:
- Datasets folder
- dataset_description.xml
- Copy and paste the contents of the patch to your US 2020 data location:
<install path>\ArcGIS\Business Analyst\US_2020
- Delete the Business Analyst cache located in your user profile:
C:\Users\<user name>\AppData\Local\ESRI\Business Analyst
Create an Infographic Report
- Open ArcGIS Pro and set the data source to USA_ESRI_2020.
- Open the Summary Report geoprocessing tool.
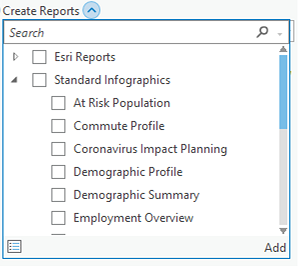
- Select one of the the Standard Infographics report templates.
These are available as of ArcGIS Pro version 2.7, in addition to standard Esri Reports
Article ID: 000025234
- ArcGIS Business Analyst Pro
- ArcGIS Pro 2 7 x
Get support with AI
Resolve your issue quickly with the Esri Support AI Chatbot.


Related Information
Discover more on this topic
Search for related information
Find training related to this topic
Explore ideas and give feedback
Get help from ArcGIS experts
Start chatting now