HOW TO
Modify point symbol size in list elements using advanced formatting in ArcGIS Dashboards
Summary
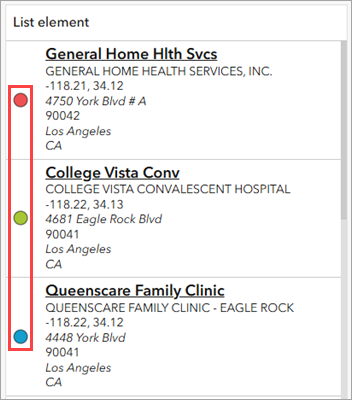
In ArcGIS Dashboards, symbol sizes in a list element are automatically populated by default when 'Adjust size automatically' is checked in the Symbol style pane in ArcGIS Online Map Viewer. When multiple field values are displayed, the symbols appear disproportionately small, which can lead to misinterpretation of the data. The image below shows the symbols in the list element.
This limitation can be addressed with advanced formatting by adding Scalable Vector Graphics (SVG) icons and defining the size value directly within the expression. This article provides the workflow to modify the basic point symbol size in the list element using advanced formatting in ArcGIS Dashboards.
Procedure
- Open the dashboard edit page.
- Disable the symbols in the list element.
- On the dashboard view, point to the upper left corner of the list element and click Configure
 .
. - In the configuration window of the list element, click the List tab.
- Under List options, under Icon, click None.
- On the dashboard view, point to the upper left corner of the list element and click Configure
- Enable advanced formatting for the list element. Refer to Steps 1 through 2 in ArcGIS Dashboards: Enable advanced formatting in a list for instructions.
- In the advanced formatting editor, remove the existing expression and specify the new Arcade expression as follows:
Note:
If only one color is required for the symbols in the list element, skip Step 4(a), and replace <symbol color> in Step 4(c) with the color or hex code.
- Set the icon color using the Decode function. Repeat the third line as necessary to add more attributes with their hex codes. Replace <symbol color> with the desired variable name, and replace <field name>, <attribute>, <hex code>, and <default color> with the appropriate values.
var <symbol color> = Decode(
    $datapoint["<field name>"],
    "<attribute>", "<hex code>",
    "<default color>"
);
- Specify the icon size in the expression. Replace <symbol size> with a new variable name and <value> with the desired size.
var <symbol size> = <value>;
- Create the basic icon in SVG format. Replace <svg> with a new variable name, <symbol size> with the variable name from Step 4(b), and <symbol color> with the variable name from Step 4(a).
var <svg> = `
<svg height="${<symbol size>}" width="${<symbol size>}">
    <circle
        cx="${<symbol size> / 2}"
        cy="${<symbol size> / 2}"
        r="${<symbol size> * 0.4}"
        stroke="black"
        stroke-width="1"
        fill="${<symbol color>}"
    />
</svg>`;
- Return the generated SVG as an attribute. Replace <svg> with the variable name from Step 4(c).
return {
    attributes: {
        <svg>
    }
};
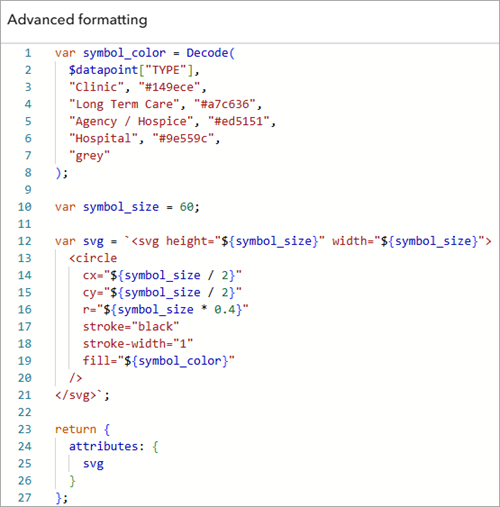
The following is an example of the complete expression in the editor. In this example, the icon color is assigned based on the TYPE field, using the same hex codes used in the web map.
var symbol_color = Decode(
    $datapoint["TYPE"],
    "Clinic", "#149ece",
    "Long Term Care", "#a7c636",
    "Agency / Hospice", "#ed5151",
    "Hospital", "#9e559c",
    "grey"
);

var symbol_size = 60;

var svg = `
<svg height="${symbol_size}" width="${symbol_size}">
    <circle
        cx="${symbol_size / 2}"
        cy="${symbol_size / 2}"
        r="${symbol_size * 0.4}"
        stroke="black"
        stroke-width="1"
        fill="${symbol_color}"
    />
</svg>`;
return {
    attributes: {
        svg
    }
};
- Customize the HTML formatting as desired.
- Under Template, in the text editor, click Source
 .
. - Configure the HTML code. In this example, the code is specified to match the default list element appearance using a flex box.
- Under Template, in the text editor, click Source
The following is an example of the HTML code in the editor.
<div style="display: flex;">
    <div style="align-items: center; display: flex; flex: 0 4 20%; justify-content: center;">
        {expression/svg}
    </div>
    <p>
        <strong><u>{field/ALIAS}</u></strong><br>
        {field/FACILITY}<br>
        {field/LONGITUDE}, {field/LATITUDE}<br>
        <i>{field/ADDRESS_1}</i><br>
        <i>{field/ZIP_CODE}</i><br>
        <i>{field/CITY}</i><br>
        <i>{field/STATE}</i>
    </p>
</div>
- Click Source
 to reflect the changes in the element preview area.
 - Click Done.
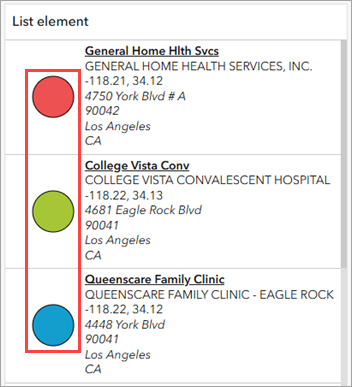
The SVG icons are displayed in the list element.
- In the dashboard layout panel, click Save
 > Save to save the changes.
 - In ArcGIS Dashboards, refresh the dashboard view page to reflect the changes.
Article ID: 000038170
- ArcGIS Dashboards
Get support with AI
Resolve your issue quickly with the Esri Support AI Chatbot.


Related Information
Discover more on this topic
Search for related information
Find training related to this topic
Explore ideas and give feedback
Get help from ArcGIS experts
Start chatting now