HOW TO
Enable row striping with custom background colors in ArcGIS Dashboards table elements
Summary
In ArcGIS Dashboards, enabling row striping for table elements improves readability by visually distinguishing rows with alternating background colors. By default, white and light gray striping is applied, offering limited options for color customization.
In certain scenarios where color adjustment is necessary or preferred, specifying the striping colors ensures better legibility, maintains a consistent visual flow, and aligns the table's appearance with the overall dashboard theme. This article provides the workflow to enable row striping with custom background colors using advanced formatting in ArcGIS Dashboards table elements.
Procedure
- Open the dashboard edit page.
- On the dashboard view, hover over the ellipsis in the upper left corner of the table element and click Configure
 .
. - Enable advanced formatting for the table element. Refer to Step 1 and Step 2 in ArcGIS Dashboards: Enable advanced formatting in a table for instructions.
Note:
Enabling advanced formatting causes the existing row striping to be removed from the table element.
- Specify the advanced formatting Arcade expression.
- Customize the colors using the rowindex profile variables. Paste the following expression at the first line of the editor, before the existing expression, and replace <variable name> with the relative variable. For <color>, replace it with the hexadecimal or named color value to specify the colors.
var <variable name> = '';
if ($rowindex % 2 == 0) {
  color = '<color>';
} else {
  color = '<color>';
}
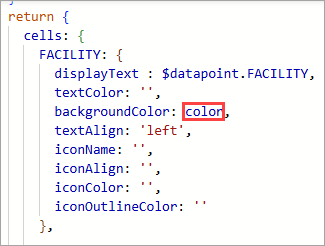
- Apply the specified colors as the background colors by assigning the variable to the backgroundColor property of the desired columns. Refer to ArcGIS Dashboards: Format tables for more information.
The code below is the full backgroundColor property assigned with the variable from Step 4(a). In this example, the variable is set as color.
backgroundColor: color,
Note:
Optionally, remove the unrelated properties from the editor.
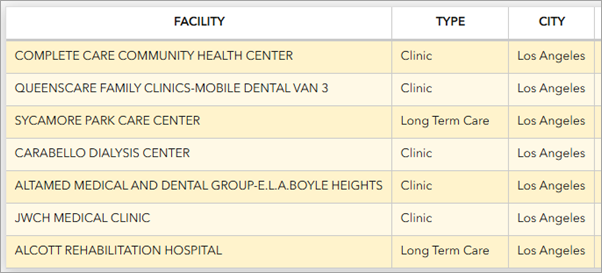
The custom row striping colors are applied to the table element in the preview area.
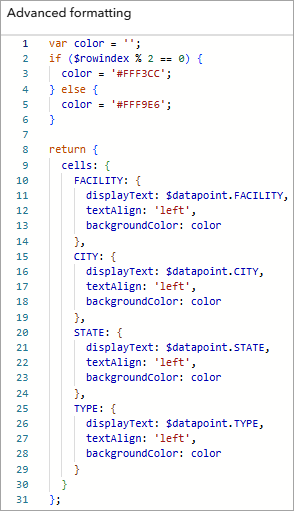
The following shows the complete expression used in this workflow. In this example, hexadecimal values are used to replace <color> from Step 4(a), and the unnecessary properties are removed from the expression.
var color = '';
if ($rowindex % 2 == 0) {
  color = '#FFF3CC';
} else {
  color = '#FFF9E6';
}

return {
  cells: {
    FACILITY: {
      displayText: $datapoint.FACILITY,
      textAlign: 'left',
      backgroundColor: color
    },
    CITY: {
      displayText: $datapoint.CITY,
      textAlign: 'left',
      backgroundColor: color
    },
    STATE: {
      displayText: $datapoint.STATE,
      textAlign: 'left',
      backgroundColor: color
    },
    TYPE: {
      displayText: $datapoint.TYPE,
      textAlign: 'left',
      backgroundColor: color
    }
  }
};
- Click Done.
- In the dashboard layout panel, click Save
 > Save to save the changes.
 - In ArcGIS Dashboards, refresh the dashboard view page to reflect the changes.
Article ID: 000038623
- ArcGIS Dashboards
Get support with AI
Resolve your issue quickly with the Esri Support AI Chatbot.


Related Information
Discover more on this topic
Search for related information
Find training related to this topic
Explore ideas and give feedback
Get help from ArcGIS experts
Start chatting now