HOW TO
Display hidden common polygon boundaries in ArcGIS Pro
Summary
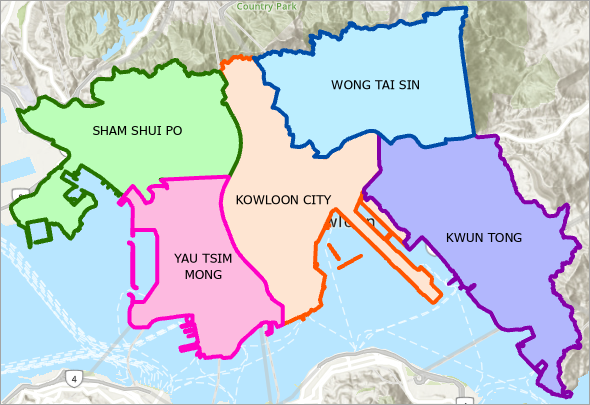
In ArcGIS Pro, polygon boundaries are symbolized with distinct outlines defined by different colors and widths. However, when adjacent polygons share a boundary, one of the overlapping edges is hidden by default. This reduces map readability and creates visual inconsistencies, especially when the boundaries are symbolized differently from one another, making it difficult to distinguish between the polygon features, as shown in the image below.
This article provides the workflow to display the hidden common polygon boundaries in ArcGIS Pro.
Procedure
To display hidden common polygon boundaries, adjust the polygon boundaries placement settings.
- Open the ArcGIS Pro project.
- Specify the existing symbology offset value.
- In the Contents pane, right-click the polygon feature layer and click Symbology.
- In the Symbology pane, click the desired class symbol on the Classes tab. In this example, the KOWLOON CITY class is selected.
- On the Properties tab, click the Layers
 tab.
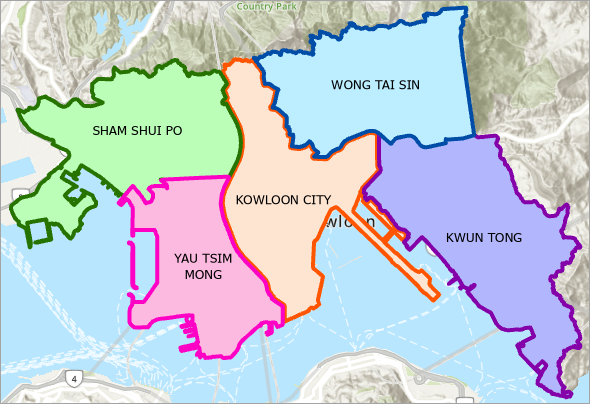
tab. - Expand Offset effect and specify the Offset value. Set a negative value to fully display the polygon boundary while keeping the boundary located inside the feature.
- Click Apply or toggle Auto Apply on.
The image below shows the hidden common polygon boundary displayed in the map view.
Note:
The following steps apply when configuring a symbology for multiple polygons at once. Colors are automatically assigned based on the selected color scheme but can be customized as desired.
- Save the configured symbol to a style. Refer to Steps 2 through 4 in ArcGIS Pro: Save a point, line, or polygon symbol to a style for instructions.
- Apply the saved style to the remaining polygons.
- In the Symbology pane, click Return to primary symbology page
 .
. - On the Classes tab, click More and check the Format all symbols check box.
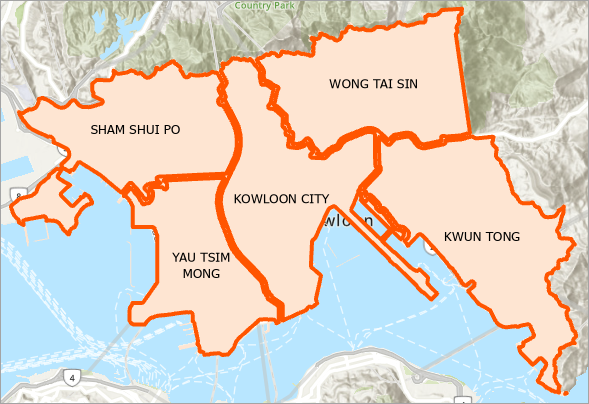
- On the Gallery tab, under Favorites, select the newly saved style.
- In the Symbology pane, click Return to primary symbology page
The image below shows the style applied to each polygon in the map view.
- Customize the polygon fill colors.
- In the Symbology pane, click Return to primary symbology page
 .
. - Under Primary Symbology, click the Color scheme drop-down arrow and select a color scheme.
- Click Color scheme options
 , and select Apply to fill and outline.
- In the Symbology pane, click Return to primary symbology page
- Customize the polygon outline colors.
- In the Symbologypane, under Primary Symbology, click Color scheme options
 and select Apply to outline.
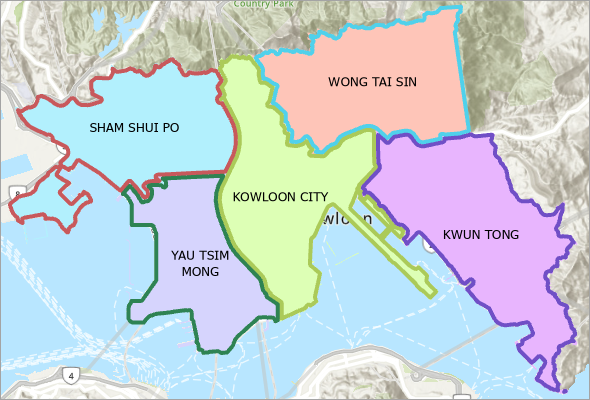
 - Click the Color scheme drop-down arrow and select a different color scheme.
- In the Symbologypane, under Primary Symbology, click Color scheme options
The image below shows the polygons with randomly assigned fill colors and outlines in the map view.
Article ID: 000035433
- ArcGIS Pro
Get support with AI
Resolve your issue quickly with the Esri Support AI Chatbot.


Related Information
Discover more on this topic
Search for related information
Find training related to this topic
Explore ideas and give feedback
Get help from ArcGIS experts
Start chatting now