HOW TO
Display externally hosted images in ArcGIS Dashboards list elements
Summary
In ArcGIS Dashboards, images can be incorporated into list elements based on defined conditions to provide visual context and help users interpret the displayed information more easily. In scenarios where images are hosted externally, their URLs can be incorporated through advanced formatting and referenced within the element's HTML formatting. For example, in an asset monitoring dashboard, transformer icons hosted externally can be displayed for active assets and alternate symbols for inactive ones, based on defined conditions. This article provides the workflow to configure conditional expressions in advanced formatting to display externally hosted images in ArcGIS Dashboards list elements.
Procedure
- Open the dashboard edit page.
- On the dashboard view, hover over the upper left corner of the list element and click Configure
 .
. - Enable advanced formatting for the list element. Refer to Step 1 and Step 2 in ArcGIS Dashboards: Enable advanced formatting in a list for instructions.
- In the advanced formatting editor, highlight the content and remove the existing expression.
- Specify the conditional Arcade expressions.
- Specify the conditional expression as a new variable. Paste the following expression into the editor and replace <variable_name> with the variable, <field> with the conditional field, <attribute> with the intended attribute, <image_URL> with the URL of the image to be displayed on the list element, and <default_URL> with the default image's URL.
var <variable_name> = When(
  $datapoint.<field> == '<attribute>', '<p><img src="<image_URL>"/></p>',
  '<p><img src="<default_URL>"/></p>'
);
Note:
Repeat the second line as desired to define all necessary conditions. Include a comma between conditions.
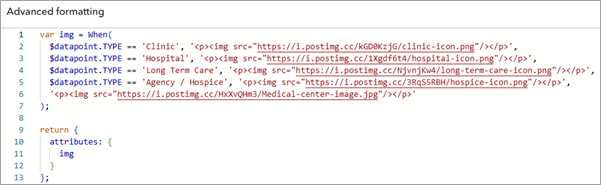
In this example, the conditional expression consists of four conditions set to display different images hosted on a public website. The following example shows the complete expression used in this workflow.
var img = When(
  $datapoint.TYPE == 'Clinic', '<p><img src="https://i.postimg.cc/kGD0KzjG/clinic-icon.png"/></p>',
  $datapoint.TYPE == 'Hospital', '<p><img src="https://i.postimg.cc/1Xgdf6t4/hospital-icon.png"/></p>',
  $datapoint.TYPE == 'Long Term Care', '<p><img src="https://i.postimg.cc/NjvnjKw4/long-term-care-icon.png"/></p>',
  $datapoint.TYPE == 'Agency / Hospice', '<p><img src="https://i.postimg.cc/3RqS5RBH/hospice-icon.png"/></p>',
  '<p><img src="https://i.postimg.cc/HxXvQHm3/Medical-center-image.jpg"/></p>'
);
- Return the conditional expression as an attribute. Paste the following expression into the editor and replace <variable_name> with the variable specified in Step 5(a).
return {
  attributes: {
    <variable_name>
  }
};
The following is an example of a complete expression in the editor.
var img = When(
  $datapoint.TYPE == 'Clinic', '<p><img src="https://i.postimg.cc/kGD0KzjG/clinic-icon.png"/></p>',
  $datapoint.TYPE == 'Hospital', '<p><img src="https://i.postimg.cc/1Xgdf6t4/hospital-icon.png"/></p>',
  $datapoint.TYPE == 'Long Term Care', '<p><img src="https://i.postimg.cc/NjvnjKw4/long-term-care-icon.png"/></p>',
  $datapoint.TYPE == 'Agency / Hospice', '<p><img src="https://i.postimg.cc/3RqS5RBH/hospice-icon.png"/></p>',
  '<p><img src="https://i.postimg.cc/HxXvQHm3/Medical-center-image.jpg"/></p>'
);

return {
  attributes: {
    img
  }
};
- Customize the HTML formatting to display the newly added attribute in the list element.
- Under Template, in the editor, place the blinking cursor at the desired location. In this example, the cursor is positioned below the last listed attribute.
- Click the Insert
 drop-down arrow.
 - Under Expression, select the newly added attribute from the drop-down list. In this example, the new attribute is set as img.
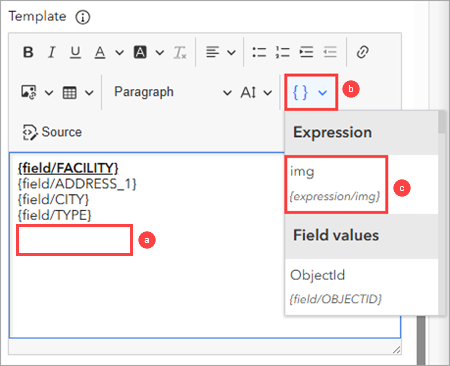
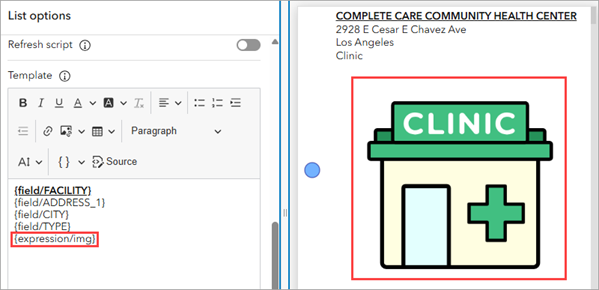
The new attribute is added to the editor, and the images are displayed in the preview area.
- Click Done.
- In the dashboard layout panel, click Save
 > Save to save the changes.
 - In ArcGIS Dashboards, refresh the dashboard view page to reflect the changes.
Article ID: 000038429
- ArcGIS Dashboards
Get support with AI
Resolve your issue quickly with the Esri Support AI Chatbot.


Related Information
Discover more on this topic
Search for related information
Find training related to this topic
Explore ideas and give feedback
Get help from ArcGIS experts
Start chatting now