HOW TO
Create points representing the highest and lowest elevations within polygon features in ArcGIS Pro
Summary
In ArcGIS Pro, creating the highest and lowest elevation points within polygon features on digital elevation models (DEMs) can be useful in situations where the infrastructures are dependent on elevations such as water tanks, beacons, or landfills.
Apply the workflow provided to create point features representing the highest and lowest elevations within each polygon feature on the DEM using the Zonal Statistics, Raster Calculator, and Raster to Point tools.
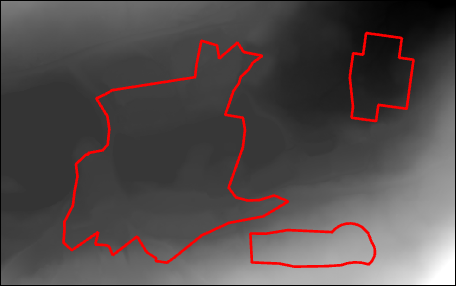
The image below shows a DEM with several polygon features.
Procedure
Note:
The Zonal Statistics and Raster Calculator tools require the ArcGIS Spatial Analyst or Image Analyst license.
- Open the ArcGIS Pro project with the DEM.
- Identify the highest elevation within the polygon feature using the Zonal Statistics tool. This tool generates a new raster that changes all the cell values in the polygon to the highest elevation.
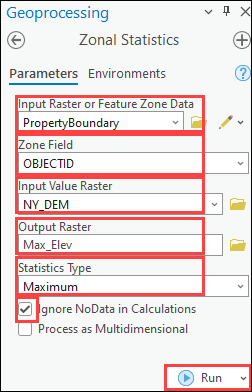
- In the Geoprocessing pane, search for and select Zonal Statistics (Spatial Analyst Tools).
- In the Zonal Statistics pane, for Input Raster or Feature Zone Data, select the polygon feature layer from the drop-down list. In this example, PropertyBoundary is selected.
- For Zone Field, select the field containing the value defining each polygon. In this example, the OBJECTID field is selected.
- For Input Value Raster, select the DEM layer containing the elevation value. In this example, NY_DEM is selected.
- For Output Raster, specify the output name. In this example, the Max_Elev name is used to represent the output of the highest elevation.
- For Statistics Type, select Maximum to calculate the highest value from the input value raster.
- Ensure the Ignore NoData in Calculations check box is checked to avoid using data with no value.
- Click Run.
- Create a conditional statement using the Raster Calculator tool to identify the cells in the DEM that correspond to the highest elevation in each polygon.
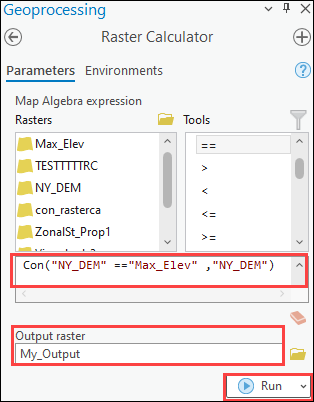
- In the Geoprocessing pane, search for and select Raster Calculator (Spatial Analyst Tools).
- In the Raster Calculator pane, insert the following expression in the Map Algebra expression box. Replace <DEM> with the name of the DEM layer and <Max_or_Min_elevation> with the name of the output raster layer created in Step 2.
Con("<DEM>" == "<Max_or_Min_elevation>","<DEM>")
- For Output raster, specify the location and name of the output raster.
- Click Run to run the expression.
- Convert the raster into a point feature using the Raster to Point tool.
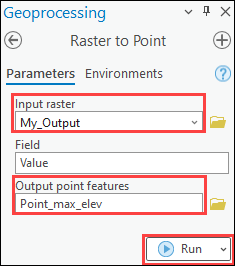
- In the Geoprocessing pane, search for and click Raster to Point (Conversion Tools).
- Select the raster output from Step 3 for Input raster and specify a name for Output point features.
- Click Run.
- To identify the lowest elevation, repeat Steps 2 through 4. When configuring the Zonal Statistics tool, select Minimum for Statistics Type.
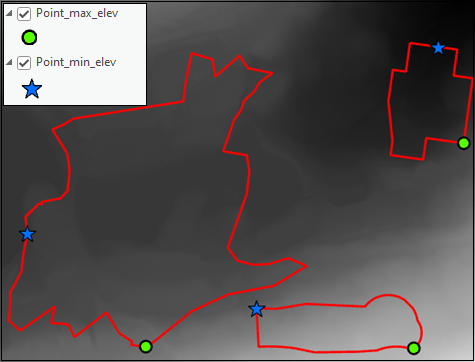
The image below shows the point features created within the polygon features on the DEM. The highest elevation points are represented by the circle and the lowest elevation points are represented by the star.
Article ID: 000030199
- ArcGIS Pro 3 1
- ArcGIS Pro 3 0
- ArcGIS Pro 2 x
Get support with AI
Resolve your issue quickly with the Esri Support AI Chatbot.


Related Information
Discover more on this topic
Search for related information
Find training related to this topic
Explore ideas and give feedback
Get help from ArcGIS experts
Start chatting now