HOW TO
Symbolize non-spatial tabular data or related data in ArcMap
Summary
Tabular data are useful in providing additional attribute information of a feature layer. While tabular data with geographic information (latitude and longitude) can be displayed on the map using the Display XY Data function, tabular data without geographic information can be connected to a feature layer with geographic information by performing a join or using the Make Query Table tool.
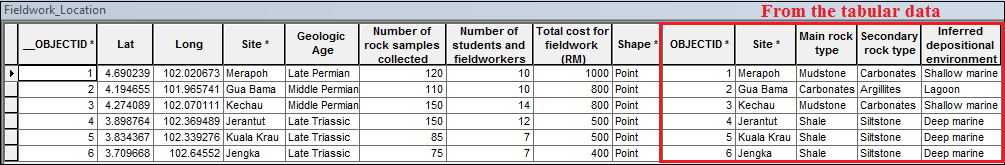
In this example, details about a fieldwork expedition in Central Peninsular Malaysia are displayed. The image below shows data from the feature layer and non-spatial tabular data.
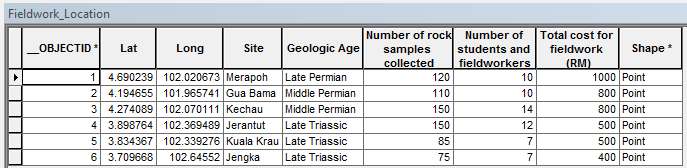
The feature layer named Fieldwork_Location contains geographic information in the form of latitude and longitude. Other fields are Site, Geologic Age, Number of rock samples collected, Number of students and fieldworkers, Total cost for fieldwork (RM), and Shape. The Site field is used to create a relationship with the non-spatial tabular data.
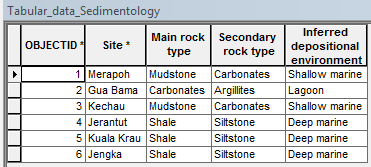
Non-spatial tabular data named Tabular_data_Sedimentology contain the following fields: Site, Main rock type, Secondary rock type, and Inferred depositional environment. The Site field is the common attribute in a one-to-one relationship between the tabular data and the feature layer.
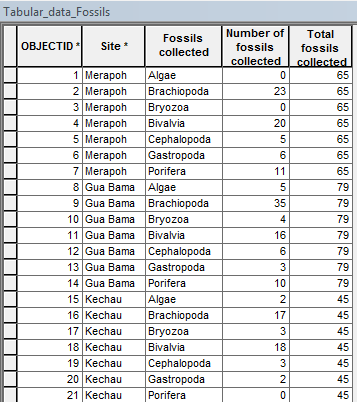
Non-spatial tabular data named Tabular_data_Fossils contain the following fields: Site, Fossils collected, Number of fossils collected, and Total fossils collected. The Site field is related to the Site field in the feature layer in a one-to-many relationship, and is the common attribute between the tabular data and the feature layer.
Procedure
(Feature layer):(Tabular data) with a one-to-one (1:1) relationship
When a non-spatial tabular data has a one-to-one relationship with a feature layer, perform a join operation before symbolizing the joined data. For more information, refer to Essentials of joining tables and Managing joined tables.
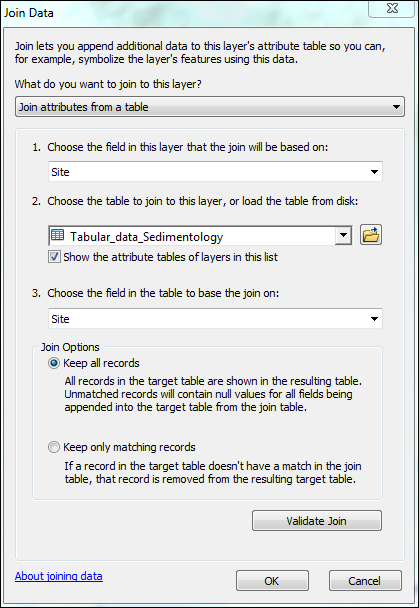
- In ArcMap, navigate to the feature layer and create a join with the desired tabular data. Follow the steps described in Joining attributes in one table to another. In this example, the Fieldwork_Location feature layer is joined to the Tabular_data_Sedimentology tabular data by the common field, Site.
The attribute table of the feature layer displays the joined information from the tabular data.
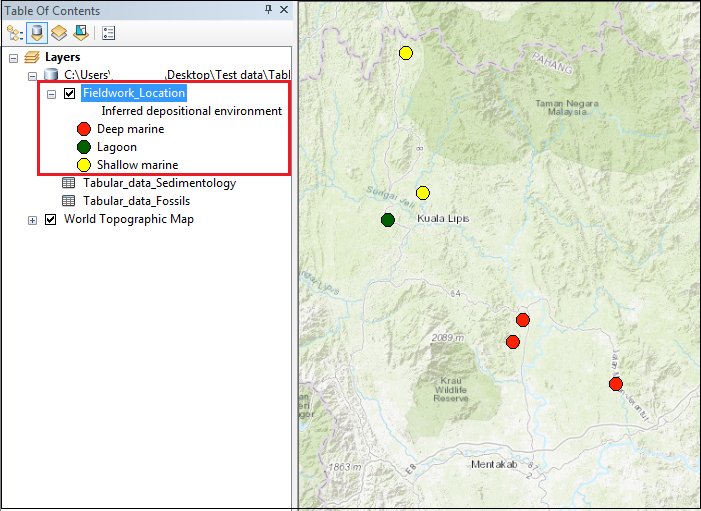
- Symbolize the feature layer. Right-click the feature layer and select Properties > Symbology. The attributes joined from the tabular table are included in the Value Field drop-down. In this example, the feature layer is symbolized based on the attribute obtained from the tabular data, that is, Inferred depositional environment.
(Feature layer):(Tabular data) with a one-to-many (1:M) relationship
In ArcMap, a 1:M or M:M relationship is commonly connected by creating a relate between the feature layer and the tabular data. However, it is possible to join non-spatial tabular data and a feature layer in a one-to-many relationship using the Make Query Table tool. For more information, refer to How To: Create a one-to-many join in ArcMap.
Note:
For this method, the following caveats must be noted.
• Use non-spatial tabular data stored within a geodatabase or database connection
• Symbolize related data up to a second-level nested relationship
- In ArcMap, click Search
 and search for the Make Query Table tool.
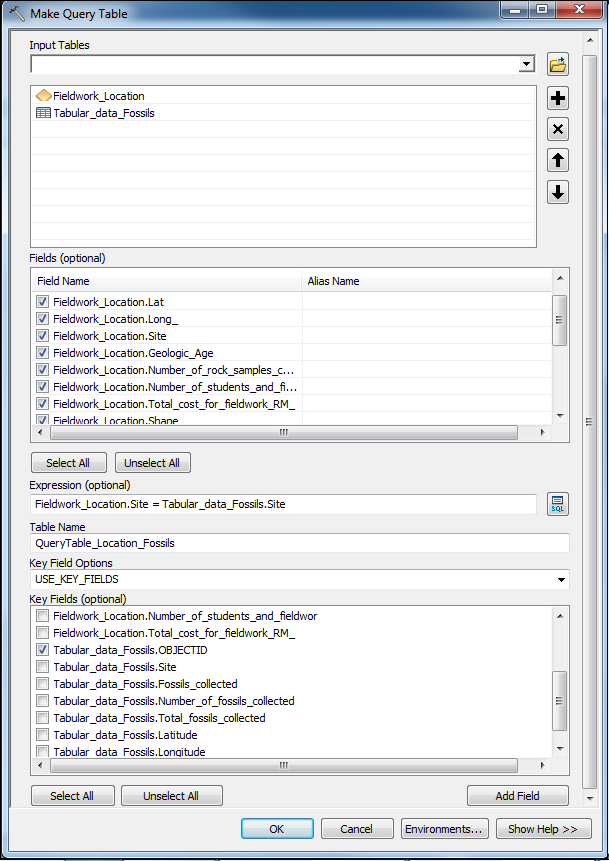
 - In the Make Query Table dialog box:
- For Input Fields, select the feature layer and the tabular data to join. In this example, they are Fieldwork_Location and Tabular_data_Fossils.
- For Fields, select fields to appear in the output table.
Note:
Include the Shape field in the selection to create a temporary layer output. Otherwise, a table view is returned.
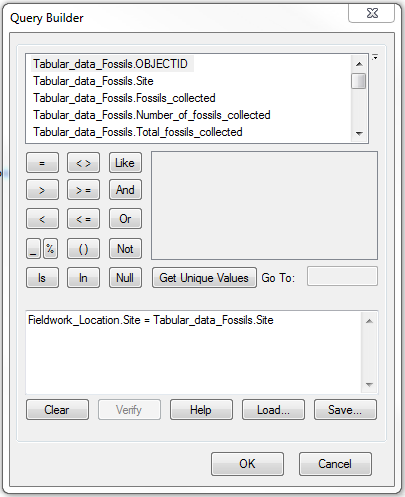
- For Expression, click the SQL icon
 . In the Query Builder dialog box, construct the expression to specify the subset of records, and click OK. In this example, the Site field in the feature layer equals the Site field in the tabular data. In Query Builder, it is Fieldwork_Location.Site=Tabular_data_Fossils.Site. Click OK.
- For Table Name, specify the name of the output table.
- For Key Field Options, select USE_KEY_FIELDS.
- For Key Fields, specify the fields that uniquely identify a row. In this example, the OBJECTID of the tabular data, Tabular_data_Fossils_OBJECTID, is used.
- Click OK.
A temporary layer is created in Table Of Contents.
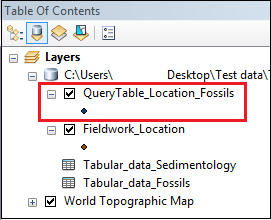
Note:
The temporary layer created remains in Table Of Contents if the document is saved before ArcMap is closed. However, the layer is not stored in the geodatabase, so it is not available for other projects. To create a permanent feature class, use methods such as exporting the data or the Copy Features tool. Alternatively, use the Save To Layer File tool to create a layer file.
- Create a permanent feature class. In this example, the Copy Features tool is used. A feature class is added to the geodatabase and Table Of Contents.
- Symbolize the feature layer. Right-click the feature layer, and select Properties > Symbology > Multiple Attributes. For more information, refer to How To: Symbolize points based on multiple attribute values. Configure the symbology.
- For Value Fields, select the original field from the tabular data that portrays the one-to-many relationship with the common field. In this example, the Fossils collected field is selected. For each site listed (the common field between the feature layer and tabular data), there are seven fossil types analyzed.
- Uncheck <all other values> and select Add All Values.
- For Variation by, select either Color Ramp or Symbol Size.
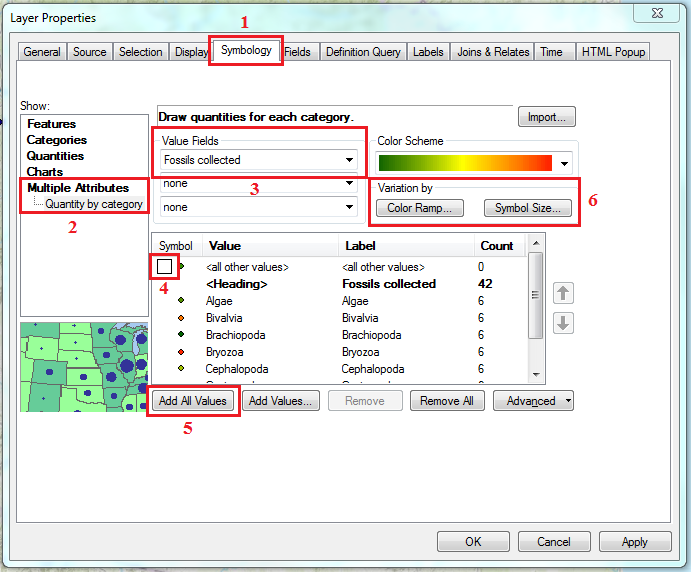
- For the Value field of the chosen category, select the secondary variable to symbolize the primary variable (the related data) specified in Step 4a. In this example, the Symbol Size category is selected and the Number of fossils collected is used as the secondary variable.
Note:
For the Variation by field, only integer fields are listed in the Value field drop-down. So, it is possible to symbolize related data only with a numeric variable.
- If necessary, specify other optional fields such as Symbol Size and Classes. Click OK.
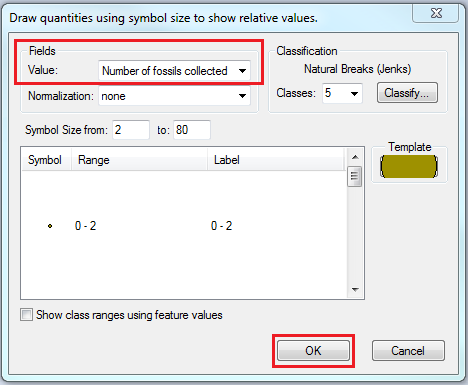
- Click OK.
The image below shows the related data (Fossils collected) symbolized based on the Number of fossils collected. The types of fossils are differentiated by color, while the number of fossils collected is differentiated by size.
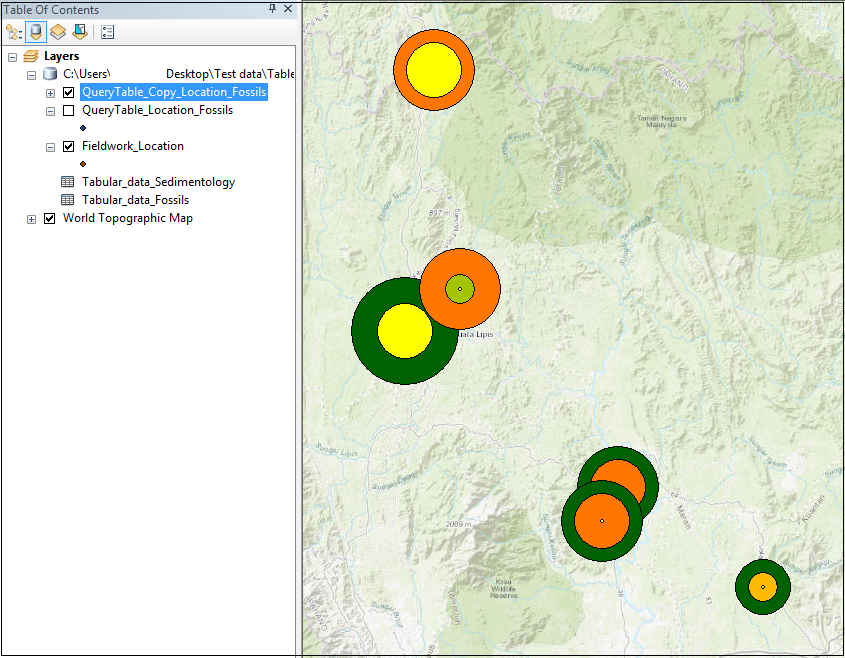
Note:
In ArcGIS Online, it is possible to symbolize related data by creating a one-to-many join using Join Features between a feature layer and non-spatial tabular data, and symbolizing the output join layer using the Types and Size symbology.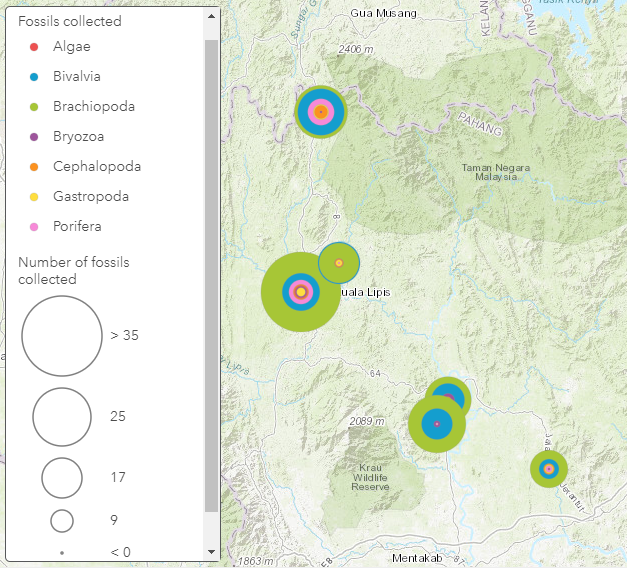
Article ID: 000022371
- ArcMap
Get support with AI
Resolve your issue quickly with the Esri Support AI Chatbot.


Related Information
Discover more on this topic
Search for related information
Find training related to this topic
Explore ideas and give feedback
Get help from ArcGIS experts
Start chatting now