HOW TO
Create a chart of the number of features within a polygon in a web app
Summary
The number of features within a polygon, such as population distribution or the number of service centres available in a city, can be represented in a chart and displayed in a web app.
Procedure
The following are steps to create a chart of the number of features within a polygon in a web app.
- Count the number of point features in the polygon by performing a spatial join in ArcMap. For more information, refer to: How To: Count the number of point features within a polygon.
- Publish the map to ArcGIS Online as a hosted feature layer.
- Add the layer to the web map from which the web app was created. Save the web map.
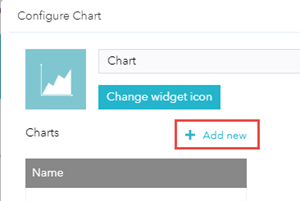
- In Web AppBuilder for ArcGIS, add the Chart widget to the web app, and click Add new.
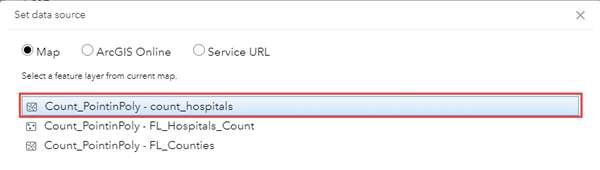
- Select the newly published layer containing the feature count.
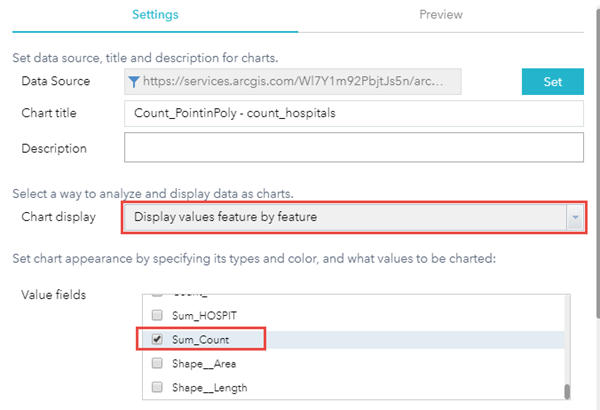
- Select Display values feature by feature from the Chart display drop-down list.
- In the Value fields check list, check the field containing the count value (e.g.: Sum_Count).
- Select the desired chart type.
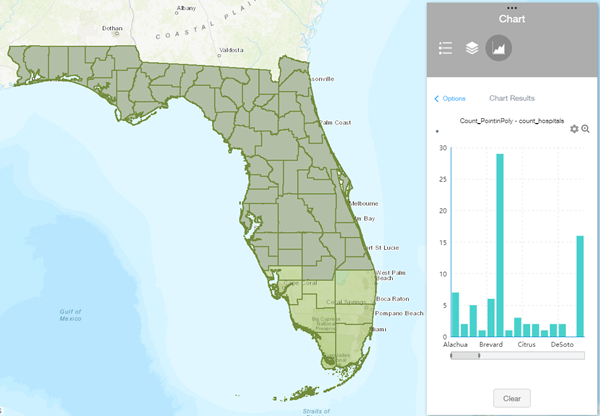
- Check if the preview displays as desired, and click OK. The following chart displays the number of hospitals located in each Florida county.
Article ID: 000018446
Software:
- ArcGIS Web AppBuilder
- ArcGIS Desktop
- ArcGIS Online
Get support with AI
Resolve your issue quickly with the Esri Support AI Chatbot.


Related Information
Discover more on this topic
Search for related information
Find training related to this topic
Explore ideas and give feedback
Get help from ArcGIS experts
Start chatting now