HOW TO
Display time as hours and minutes in ArcGIS Dashboards indicator elements
Summary
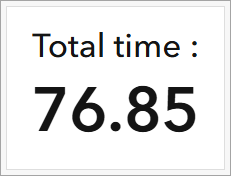
In ArcGIS Dashboards, displaying numerical summaries such as total time in an indicator element highlights important values to viewers. Time displayed in hours and minutes can provide clearer interpretations as compared to time recorded in hours with decimals. This format can be configured through the advanced formatting capabilities of the element and this article provides the workflow. In this example, the indicator element is initially configured to display total time in hours and later converted to hours and minutes.
Procedure
- Open the dashboard edit page.
- On the dashboard view, hover over the upper-left corner of the indicator element and click Configure
 .
. - Enable advanced formatting for the indicator element. Refer to Steps 1 and 2 in ArcGIS Dashboards: Enable advanced formatting in an indicator for instructions.
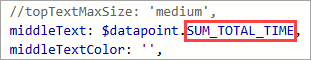
- On the editor, highlight and copy the summary field name from the middleText property of the indicator element. Paste it in a text editor such as Notepad. Refer to ArcGIS Dashboards: Format indicators for more information.
- Specify the advanced formatting Arcade expression.
- Calculate the hours with the Division operator and minutes with the Modulus operator while applying the Floor function to round each value down to the nearest whole number. Refer to ArcGIS Arcade: Arithmetic operators and ArcGIS Arcade: Math functions for more information. Copy and paste the following expression at the top of the editor. Replace <field_name> with the field copied in Step 4, and replace <duration>, <hours>, <minutes>, and <output> with the desired variables.
var <duration> = $datapoint.<field_name> * 60

var <hours> = Floor(<duration> / 60)
var <minutes> = Floor(<duration> % 60)

var <output> = <hours> + ' hours, ' + <minutes> + ' minutes'
- Apply the final output of the expression by assigning the variable to the middleText property of the indicator element. Refer to ArcGIS Dashboards: Format indicators for more information.
The code below assigns the final variable from Step 5(a) to the middleText property. In this example, the <output> variable is set to time_final.
middleText: time_final,
The middle text value is updated in the preview area of the indicator element.

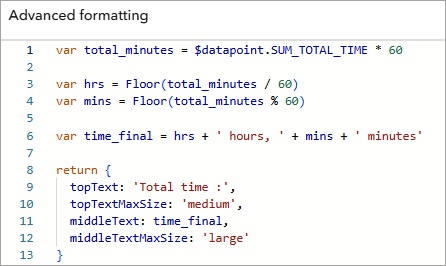
The following code block shows the complete expression used in this workflow, with blank properties and comments removed.
var total_minutes = $datapoint.SUM_TOTAL_TIME * 60

var hrs = Floor(total_minutes / 60)
var mins = Floor(total_minutes % 60)

var time_final = hrs + ' hours, ' + mins + ' minutes'

return {
  topText: 'Total time :',
  topTextMaxSize: 'medium',
  middleText: time_final,
  middleTextMaxSize: 'large'
}
- Click Done.
- In the dashboard layout panel, click Save
 > Save to save the changes.
 - In ArcGIS Dashboards, refresh the dashboard view page to reflect the changes.
Article ID: 000037605
- ArcGIS Dashboards
Get support with AI
Resolve your issue quickly with the Esri Support AI Chatbot.


Related Information
Discover more on this topic
Search for related information
Find training related to this topic
Explore ideas and give feedback
Get help from ArcGIS experts
Start chatting now