HOW TO
Apply layer transparency in an ArcGIS Survey123 report template to hide geometry types
Summary
The steps in this article describe how to apply layer transparency in an ArcGIS Survey123 report template to hide geopoint, geotrace, and geoshapes on a map question for the ArcGIS Survey123 web app.
When including a map in a survey report, the survey's default map is used unless a different map is specified by the user using the "map" method in the report template. With either option, the survey records are visualized with the default symbology (a blue pin symbol) on top of the layers in the map. Often times, users want to have their own data represented on a map in survey reports to show to other organizations and stakeholders. In such scenarios, the user may want to change the symbology for a survey layer or change the visualization settings, such as transparency.
Procedure
The symbology and transparency of the survey points in a geopoint, geotrace, or geoshape map in a report can be controlled using the "drawingInfo" method in the report template. This method allows users to apply the drawing info from survey's current layer or a different feature layer using feature layer URL, giving user control over the symbology of their survey layer on report maps. Below are some examples of how drwingInfo can be used in the report template syntax:
- Using the default map with drawing info from a feature layer:
- ${geopoint_question| drawingInfo:"currentLayer"}
- Using a custom map with drawing info from the survey layer:
- ${geopoint_question| drawingInfo:”https://services.arcgis.com/LMjyaBcDR6YFiqk8/ArcGIS/rest/services/FeatureLayerName/FeatureServer/0”}
The following example outlines the workflow for making the survey layer transparent on the report map.
- Create a new hosted layer with the same geometry type and schema as your survey's hosted feature layer.
- Open the layer in Map Viewer Classic.
- Edit layer style and set the transparency to 100% (or modify the layer drawing info as desired).
- Save the layer. Alternatively, you can modify the layer's drawing info using the REST API or any other methods.
- Get the layer URL from item details page of the layer.
- Add the URL as the drawingInfo parameter to your report template syntax.
This examples below show how this method can be used in a Survey123 report template to control layer's drawing info in a map in the Summary section of a report:
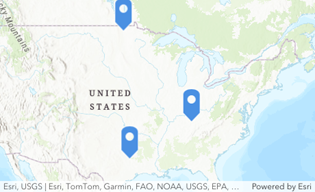
Default map / Default symbology:
${map_question|orderByFields:"objectid DESC"|resultRecordCount:3}
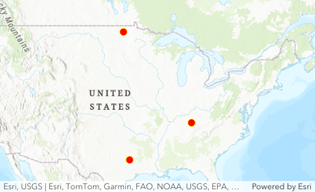
Default map / Survey’s layer symbology:
${map_question|orderByFields:"objectid DESC"|resultRecordCount:3|drawingInfo:”currentLayer”}
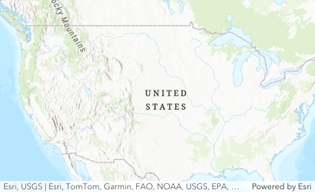
Default map / Drawing info from a feature layer (with 100% transparency):
${map_question|orderByFields:"objectid DESC"|resultRecordCount:4|drawingInfo:”https://services.arcgis.com/LMjyaBcDR6YFiqk8/ArcGIS/rest/services/FeatureLayerName/FeatureServer/0”}
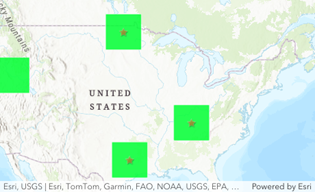
Custom map / Drawing info from a feature layer:
${map_question|orderByFields:"objectid DESC"|resultRecordCount:3|map:”cbe3627a21914c61b57dc28841cb7970”|drawingInfo:”https://services.arcgis.com/LMjyaBcDR6YFiqk8/ArcGIS/rest/services/FeatureLayerName/FeatureServer/0”}
Article ID: 000032459
- ArcGIS Survey123 Website
Get support with AI
Resolve your issue quickly with the Esri Support AI Chatbot.


Related Information
Discover more on this topic
Search for related information
Find training related to this topic
Explore ideas and give feedback
Get help from ArcGIS experts
Start chatting now