操作方法
操作方法:在 ArcGIS Dashboards 中使用 Arcade 在指示器元素中显示倒计时
描述
在 ArcGIS Dashboards 中,可以将仪表盘元素配置为以易于阅读的格式显示信息。 本文提供了使用 Arcade 表达式在指示器元素中显示倒计时的工作流。
解决方案或解决方法
- 在 ArcGIS Dashboards 的布局中,在正文选项卡上,单击添加元素,然后选择指示器。
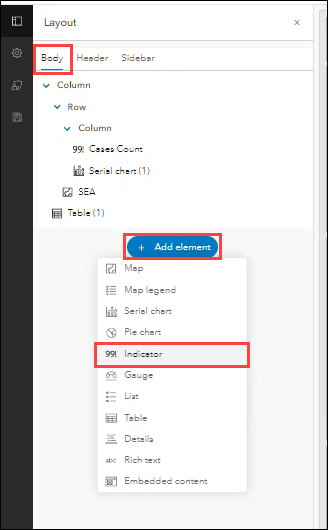
- 从添加到仪表盘的地图中选择一个图层。
- 在指示器页面,选择指示器选项卡。
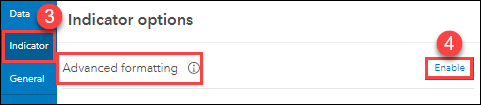
- 在指示器选项下,对于高级格式,单击启用。
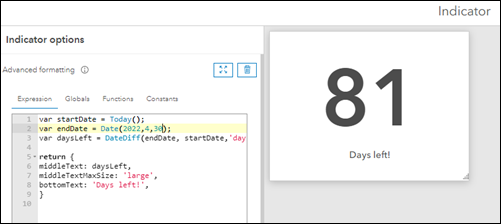
- 在表达式选项卡上,突出显示并删除框中的现有表达式。
- 将以下 Arcade 表达式复制并粘贴到框中。 对于 endDate 中的日期函数,将年、月和日替换为所需的值。
var startDate = Today();
var endDate = Date(year,month,day);
var daysLeft = DateDiff(endDate, startDate,'day');

return {
middleText: daysLeft,
middleTextMaxSize: 'large',
bottomText: 'Days left!',
}
Note:
In the Date function, months are defined by 0-11 where 0 is January and 11 is December. For example, to indicate May, type '4' as the month in the Date function.
- 指示器预览可显示倒计时。 在此示例中,startDate 为今天,2022 年 3 月 10 日,endDate 为“2022,4,30”(2022 年 5 月 30 日)。
- 单击完成。 指示器元素已被配置为在仪表板中显示倒计时。
文章 ID: 000027014
获得人工智能支持
使用 Esri Support AI Chatbot 快速解决您的问题。


相关信息
发现关于本主题的更多内容
Search for related information
Find training related to this topic
Explore ideas and give feedback
获取来自 ArcGIS 专家的帮助
立即开始聊天