操作方法
操作方法:如何使用 ArcGIS API for Python 基于 JSON 文件创建 web 地图
摘要
在某些情况下,使用 脚本创建 web 地图更为有利,因为可针对多个 web 地图进行编程。 使用 JSON 文件中指定的定义,ArcGIS API for Python 中的 gis.content.add 函数可用于创建 web 地图。
过程
可以使用 GIS 模块中的 gis.content.add 函数基于 JSON 文件表示创建 web 地图。 有两种方法:
- 在脚本中读取 JSON 文件。
- 在脚本中定义 JSON 描述。
注:
定义 JSON 描述的过程更长。 但是,用户通过该方法可以修改脚本的 JSON 表示。
以下步骤介绍了如何通过使用 json 模块读取 JSON 文件来基于 JSON 文件创建 web 地图。
-
导入所需的模块。
from arcgis.gis import GIS
from arcgis.mapping import WebMap
import json
- 指定登录凭据。
gis = GIS("https://machine.domain.com/portal","adminuser","adminpassword")
print ("Successfully Logged Into GIS: ", gis)
- 打开 JSON 文件。
with open('/home/jupyter/test2.json') as json_data:
data = json.load(json_data)
- 创建新地图。
item_properties_dict = {"type": "Web Map","title": "Test Map","tags": ["test","test1","test2"],"snippet":"This is a snippet", "text":data}

newmap = gis.content.add(item_properties = item_properties_dict)
newmap
以下 显示的是完整脚本。
from arcgis.gis import GIS
from arcgis.mapping import WebMap
import json

gis = GIS("https://machine.domain.com/portal","adminuser","adminpassword")
print ("Successfully Logged Into GIS: ", gis)

with open('/home/jupyter/test2.json') as json_data:
data = json.load(json_data)

item_properties_dict = {"type": "Web Map","title": "Test Map","tags": ["test","test1","test2"],"snippet":"This is a snippet", "text":data}

newmap = gis.content.add(item_properties = item_properties_dict)
newmap
以下 步骤 介绍了如何通过在脚本中定义 JSON 描述来创建 web 地图。
- 执行上述方法中的步骤 1 和 2。
- 定义包含用于创建 web 地图的 JSON 的字典。
data = {
"operationalLayers": [{
"id": "layer_2382",
"layerType": "ArcGISMapServiceLayer",
"url": "https://sampleserver6.arcgisonline.com/arcgis/rest/services/Census/MapServer",
"visibility": True,
"opacity": 1,
"title": "Census Data",
"layers": [{
"id": 0,
"layerDefinition": {
"source": {
"type": "mapLayer",
"mapLayerId": 0
}
},
"name": "Census Block Points",
"minScale": 99999.99998945338,
"maxScale": 0,
"parentLayerId": -1,
"defaultVisibility": True
}, {
"id": 1,
"layerDefinition": {
"source": {
"type": "mapLayer",
"mapLayerId": 1
},
"drawingInfo": {
"renderer": {
"type": "simple",
"label": "",
"description": "",
"symbol": {
"color": [0, 0, 0, 0],
"outline": {
"color": [230, 230, 0, 255],
"width": 0.39975000000000005,
"type": "esriSLS",
"style": "esriSLSSolid"
},
"type": "esriSFS",
"style": "esriSFSSolid"
}
}
}
},
"name": "Census Block Group",
"minScale": 1000000,
"maxScale": 0,
"parentLayerId": -1,
"defaultVisibility": True
}, {
"id": 2,
"layerDefinition": {
"source": {
"type": "mapLayer",
"mapLayerId": 2
},
"drawingInfo": {
"renderer": {
"type": "simple",
"label": "",
"description": "",
"symbol": {
"color": [0, 0, 0, 0],
"outline": {
"color": [230, 230, 0, 255],
"width": 0.5625,
"type": "esriSLS",
"style": "esriSLSSolid"
},
"type": "esriSFS",
"style": "esriSFSSolid"
}
}
}
},
"name": "Detailed Counties",
"minScale": 0,
"maxScale": 0,
"parentLayerId": -1,
"defaultVisibility": True
}, {
"id": 3,
"layerDefinition": {
"source": {
"type": "mapLayer",
"mapLayerId": 3
},
"drawingInfo": {
"renderer": {
"type": "simple",
"label": "",
"description": "",
"symbol": {
"color": [0, 0, 0, 0],
"outline": {
"color": [230, 230, 0, 255],
"width": 2,
"type": "esriSLS",
"style": "esriSLSSolid"
},
"type": "esriSFS",
"style": "esriSFSSolid"
}
}
}
},
"name": "states",
"minScale": 0,
"maxScale": 0,
"parentLayerId": -1,
"defaultVisibility": True
}
]
}
],
"baseMap": {
"baseMapLayers": [{
"id": "labels",
"layerType": "ArcGISTiledMapServiceLayer",
"url": "https://services.arcgisonline.com/arcgis/rest/services/Canvas/World_Dark_Gray_Base/MapServer",
"visibility": True,
"opacity": 1,
"title": "World_Dark_Gray_Base"
}, {
"id": "base",
"layerType": "ArcGISTiledMapServiceLayer",
"url": "https://services.arcgisonline.com/arcgis/rest/services/Canvas/World_Dark_Gray_Reference/MapServer",
"visibility": True,
"opacity": 1,
"title": "World_Dark_Gray_Reference"
}
],
"title": "Basemap"
},
"spatialReference": {
"wkid": 102100,
"latestWkid": 3857
},
"authoringApp": "WebMapViewer",
"authoringAppVersion": "10.6.1",
"version": "2.11"
}
- 创建新地图。
item_properties_dict = {"type": "Web Map","title": "Test Map","tags": ["test","test1","test2"],"snippet":"This is a snippet", "text":data}

newmap = gis.content.add(item_properties = item_properties_dict)
newmap
以下显示的是完整脚本。
from arcgis.gis import GIS
from arcgis.mapping import WebMap


gis = GIS("https://earl.esri.com/portal","siteadmin","siteadmin", verify_cert=False)
print ("Successfully Logged Into GIS: ", gis)

data = {
"operationalLayers": [{
"id": "layer_2382",
"layerType": "ArcGISMapServiceLayer",
"url": "https://sampleserver6.arcgisonline.com/arcgis/rest/services/Census/MapServer",
"visibility": True,
"opacity": 1,
"title": "Census Data",
"layers": [{
"id": 0,
"layerDefinition": {
"source": {
"type": "mapLayer",
"mapLayerId": 0
}
},
"name": "Census Block Points",
"minScale": 99999.99998945338,
"maxScale": 0,
"parentLayerId": -1,
"defaultVisibility": True
}, {
"id": 1,
"layerDefinition": {
"source": {
"type": "mapLayer",
"mapLayerId": 1
},
"drawingInfo": {
"renderer": {
"type": "simple",
"label": "",
"description": "",
"symbol": {
"color": [0, 0, 0, 0],
"outline": {
"color": [230, 230, 0, 255],
"width": 0.39975000000000005,
"type": "esriSLS",
"style": "esriSLSSolid"
},
"type": "esriSFS",
"style": "esriSFSSolid"
}
}
}
},
"name": "Census Block Group",
"minScale": 1000000,
"maxScale": 0,
"parentLayerId": -1,
"defaultVisibility": True
}, {
"id": 2,
"layerDefinition": {
"source": {
"type": "mapLayer",
"mapLayerId": 2
},
"drawingInfo": {
"renderer": {
"type": "simple",
"label": "",
"description": "",
"symbol": {
"color": [0, 0, 0, 0],
"outline": {
"color": [230, 230, 0, 255],
"width": 0.5625,
"type": "esriSLS",
"style": "esriSLSSolid"
},
"type": "esriSFS",
"style": "esriSFSSolid"
}
}
}
},
"name": "Detailed Counties",
"minScale": 0,
"maxScale": 0,
"parentLayerId": -1,
"defaultVisibility": True
}, {
"id": 3,
"layerDefinition": {
"source": {
"type": "mapLayer",
"mapLayerId": 3
},
"drawingInfo": {
"renderer": {
"type": "simple",
"label": "",
"description": "",
"symbol": {
"color": [0, 0, 0, 0],
"outline": {
"color": [230, 230, 0, 255],
"width": 2,
"type": "esriSLS",
"style": "esriSLSSolid"
},
"type": "esriSFS",
"style": "esriSFSSolid"
}
}
}
},
"name": "states",
"minScale": 0,
"maxScale": 0,
"parentLayerId": -1,
"defaultVisibility": True
}
]
}
],
"baseMap": {
"baseMapLayers": [{
"id": "labels",
"layerType": "ArcGISTiledMapServiceLayer",
"url": "https://services.arcgisonline.com/arcgis/rest/services/Canvas/World_Dark_Gray_Base/MapServer",
"visibility": True,
"opacity": 1,
"title": "World_Dark_Gray_Base"
}, {
"id": "base",
"layerType": "ArcGISTiledMapServiceLayer",
"url": "https://services.arcgisonline.com/arcgis/rest/services/Canvas/World_Dark_Gray_Reference/MapServer",
"visibility": True,
"opacity": 1,
"title": "World_Dark_Gray_Reference"
}
],
"title": "Basemap"
},
"spatialReference": {
"wkid": 102100,
"latestWkid": 3857
},
"authoringApp": "WebMapViewer",
"authoringAppVersion": "10.6.1",
"version": "2.11"
}

item_properties_dict = {"type": "Web Map","title": "Test Map","tags": ["test","test1","test2"],"snippet":"This is a snippet", "text":data}

newmap = gis.content.add(item_properties = item_properties_dict)
newmap
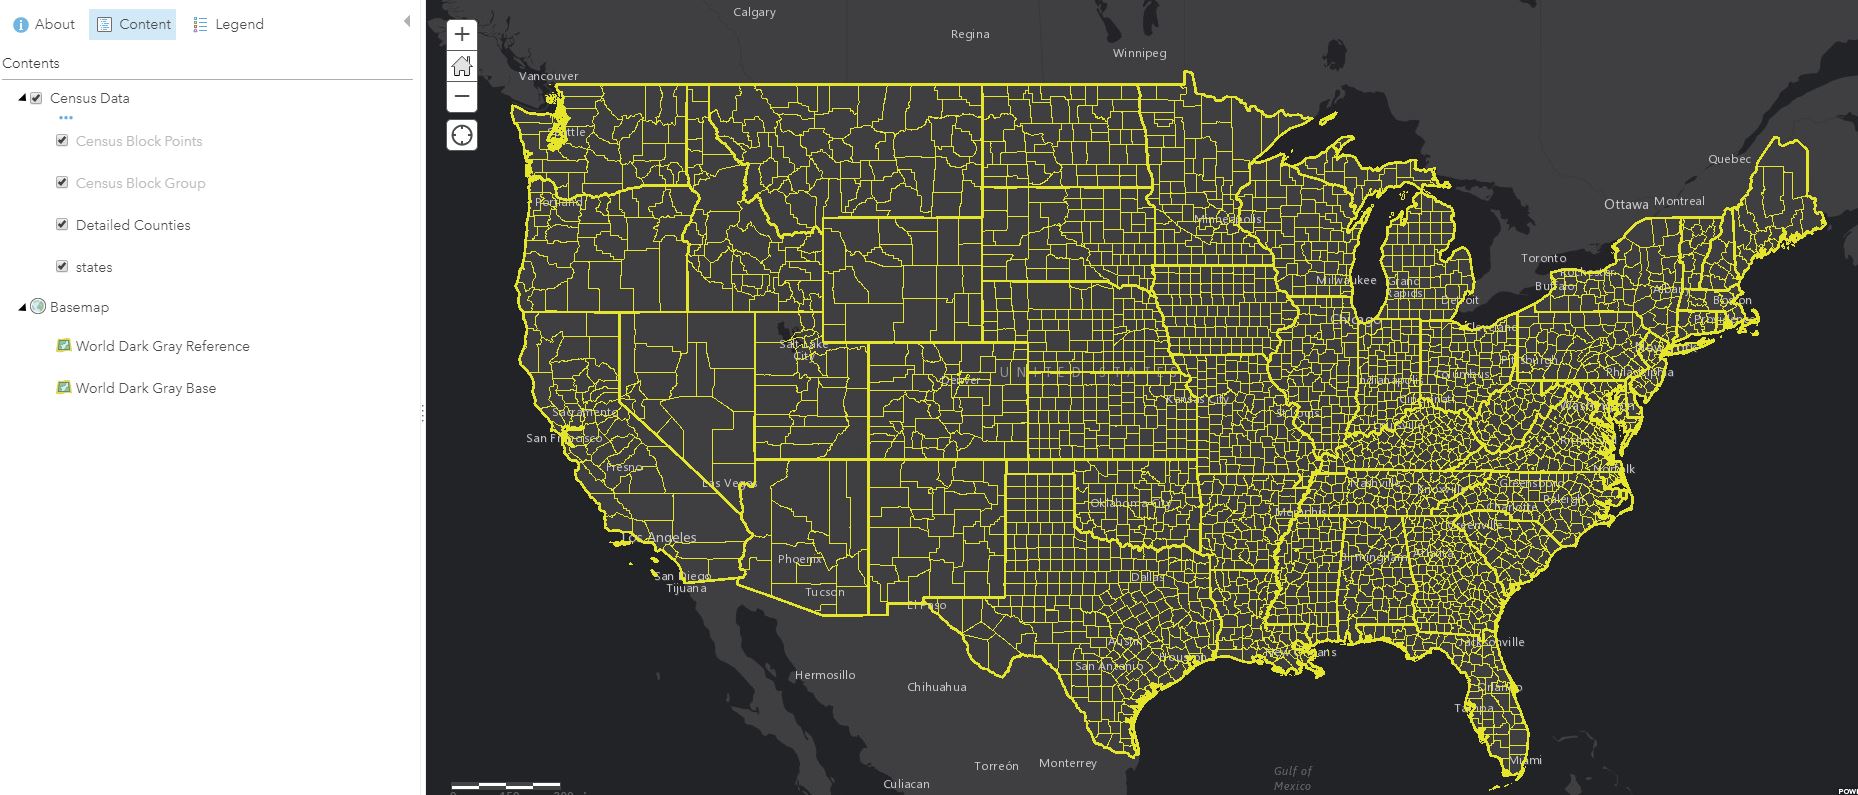
下图是新创建的 web 地图。
文章 ID: 000019701
获得人工智能支持
使用 Esri Support AI Chatbot 快速解决您的问题。


相关信息
发现关于本主题的更多内容
Search for related information
Find training related to this topic
Explore ideas and give feedback
获取来自 ArcGIS 专家的帮助
立即开始聊天