操作方法
操作方法:在 ArcGIS Pro 中根据等值线创建坡度地图
摘要
Contour lines are presented as line features in a shapefile or feature class (vector data) containing elevation values for each line. The image below shows an example of contour lines.
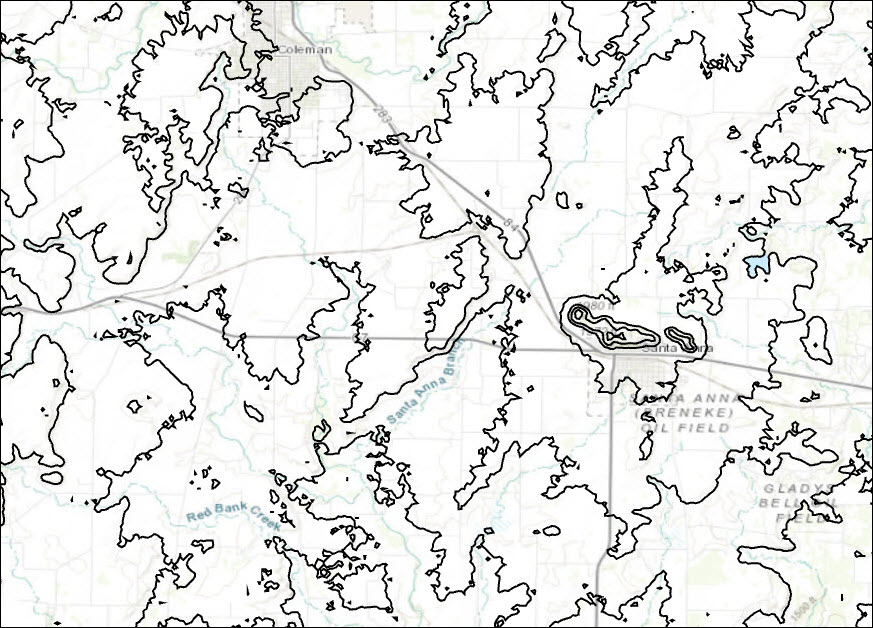
In some instances, these lines must be converted to a slope map for slope analysis. This article provides instructions to create a slope map from contour lines.
过程
To convert the contour lines to a slope map, they must be converted to a digital elevation model (DEM) using the Topo to Raster tool. The DEM data are converted to a slope map using the Slope tool.
Note:
The Topo to Raster and Slope tool require a Spatial Analyst or 3D Analyst license.
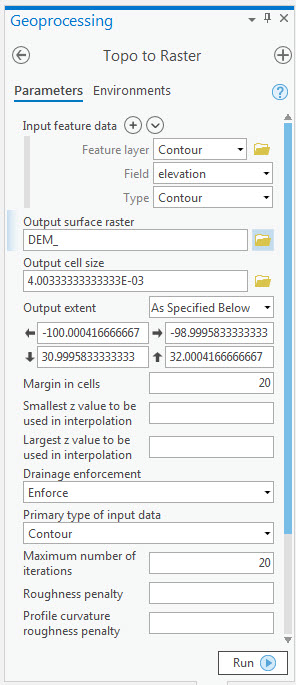
- Convert the contour layer to a DEM using the Topo to Raster tool.
- For Input feature data, select the contour layer for Feature layer, select the field containing the elevation values for Field, and select Contour for Type.
- Set a name and location for Output surface raster.
- Type the desired Output cell size or accept the default.
- Set other parameters as desired, and click Run.
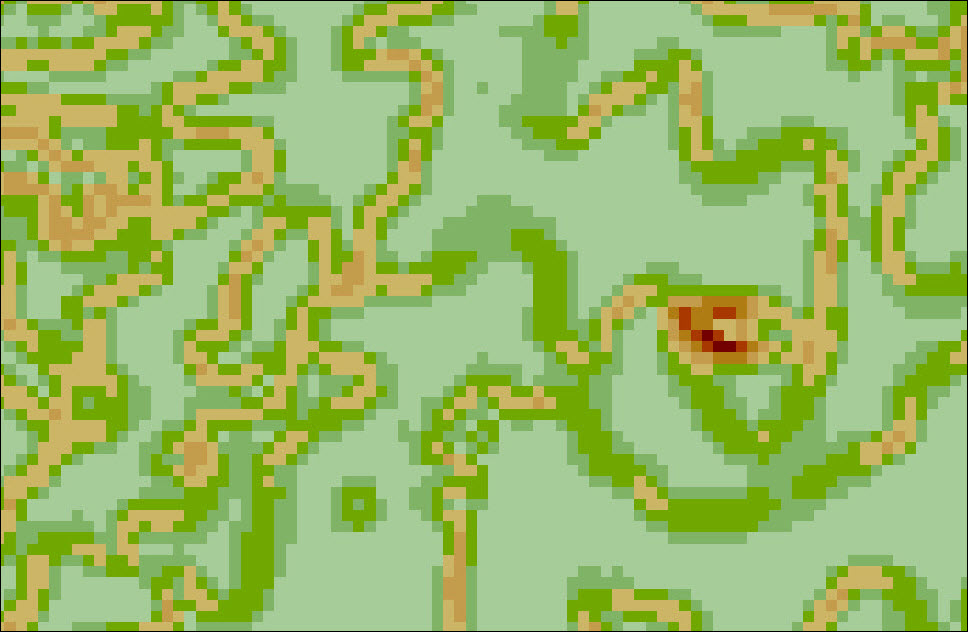
The image below shows a DEM created from the contour lines.

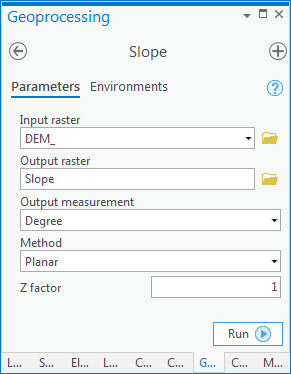
- Create a slope map from the DEM layer using the Slope tool.
- Select the created DEM layer for Input raster.
- Set a name and location for Output raster.
- Select the desired Output measurement. In this example, Degree is selected.
- Set other parameters as desired, and click Run.
文章 ID: 000023285
获得人工智能支持
使用 Esri Support AI Chatbot 快速解决您的问题。


相关信息
发现关于本主题的更多内容
Search for related information
Find training related to this topic
Explore ideas and give feedback
获取来自 ArcGIS 专家的帮助
立即开始聊天