操作方法
操作方法:如何在 Web 应用程序和 ArcGIS Online Map Viewer 中配置能够同时显示负值和正值的图表
描述
某些数据同时包含负值和正值。 例如,一家公司的年度盈亏数据、一个四季分明国家的年度气温数据,以及化石中放射性同位素的含量。 通过可视化方式呈现这些数据,有助于受众理解多个变量之间的关系并得出结论。
解决方案或解决方法
选择以下任一方案,在 Web 应用程序和 ArcGIS Online Map Viewer 中配置能够同时显示负值和正值的图表。
ArcGIS Dashboards
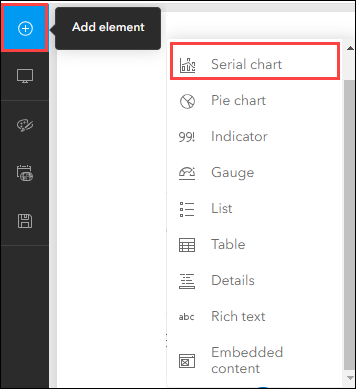
在 ArcGIS Dashboards 中,从下拉列表中选择系列图表,同时显示负值和正值。
Note:
A pie chart is not suitable to display both positive and negative values because the total does not add up to 100%.
ArcGIS Web AppBuilder
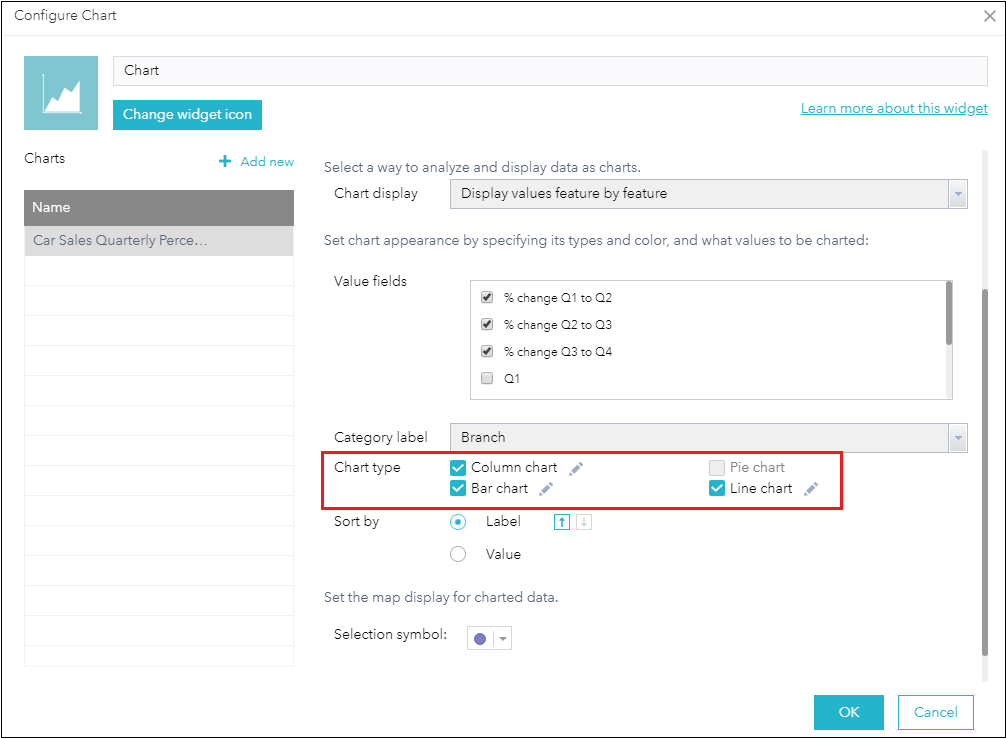
在 ArcGIS Web AppBuilder 中,添加并配置图表微件。 在图表类型字段中,选中柱状图、条形图或折线图复选框,即可在图表上同时可视化负值和正值。
Note:
In ArcGIS Web AppBuilder, a pie chart can be used to display negative values, but not a combination of positive and negative values.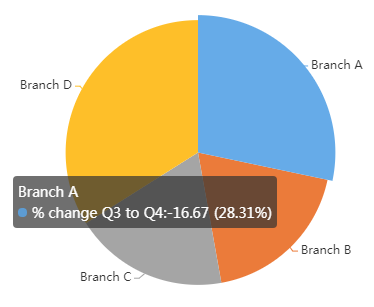
ArcGIS Online Map Viewer
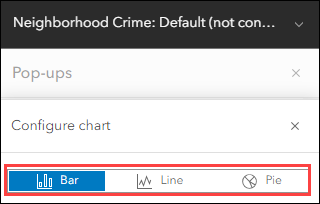
在 ArcGIS Online Map Viewer 中,请参阅 ArcGIS 博客:弹出窗口:图表元素要点,如何在弹出窗口中创建图表。 在配置图表窗格中,选择条形图、折线图或饼图选项,即可在图表上同时显示正值和负值。
Note:
In ArcGIS Online Map Viewer, using a pie chart to represent both negative values does not display any value on the chart.
文章 ID: 000020856
获得人工智能支持
使用 Esri Support AI Chatbot 快速解决您的问题。


相关信息
发现关于本主题的更多内容
Search for related information
Find training related to this topic
Explore ideas and give feedback
获取来自 ArcGIS 专家的帮助
立即开始聊天