方法
ArcGIS API for Python を使用して JSON ファイルから Web マップを作成する方法
サマリー
場合によっては、複数の Web マップにプログラミングできるため、スクリプトを使用して Web マップを作成することをお勧めします。 JSON ファイルで指定した定義を使用し、ArcGIS API for Python の gis.content.add 関数を使用して Web マップを作成できます。
手順
GIS モジュールの gis.content.add 関数を使用し、JSON ファイル表現から Web マップを作成できます。 これには、次の 2 つの方法があります。
- スクリプト内で JSON ファイルを読み取る。
- スクリプトで JSON 記述を定義する。
注意:
JSON 記述を定義するほうが、作業時間は長くなります。 ただし、この方法であれば、ユーザーはスクリプトの JSON 表現を変更することができます。
以下の手順は、json モジュールを使用して JSON ファイルを読み取り、Web マップを作成する方法を説明しています。
-
必要なモジュールをインポートします。
from arcgis.gis import GIS
from arcgis.mapping import WebMap
import json
- ログイン認証情報を指定します。
gis = GIS("https://machine.domain.com/portal","adminuser","adminpassword")
print ("Successfully Logged Into GIS: ", gis)
- JSON ファイルを開きます。
with open('/home/jupyter/test2.json') as json_data:
	data = json.load(json_data)
- 新しいマップを作成します。
item_properties_dict = {"type": "Web Map","title": "Test Map","tags": ["test","test1","test2"],"snippet":"This is a snippet", "text":data}

newmap = gis.content.add(item_properties = item_properties_dict)
newmap
以下に、完全なスクリプトを示します。
from arcgis.gis import GIS
from arcgis.mapping import WebMap
import json

gis = GIS("https://machine.domain.com/portal","adminuser","adminpassword")
print ("Successfully Logged Into GIS: ", gis)

with open('/home/jupyter/test2.json') as json_data:
	data = json.load(json_data)

item_properties_dict = {"type": "Web Map","title": "Test Map","tags": ["test","test1","test2"],"snippet":"This is a snippet", "text":data}

newmap = gis.content.add(item_properties = item_properties_dict)
newmap
以下の手順は、スクリプトで JSON 記述を定義して Web マップを作成する方法を説明しています。
- 上記の方法のステップ 1 ~ 2 を実行します。
- Web マップの作成に使用する JSON を含む辞書を定義します。
data = {
	"operationalLayers": [{
			"id": "layer_2382",
			"layerType": "ArcGISMapServiceLayer",
			"url": "https://sampleserver6.arcgisonline.com/arcgis/rest/services/Census/MapServer",
			"visibility": True,
			"opacity": 1,
			"title": "Census Data",
			"layers": [{
					"id": 0,
					"layerDefinition": {
						"source": {
							"type": "mapLayer",
							"mapLayerId": 0
}
},
					"name": "Census Block Points",
					"minScale": 99999.99998945338,
					"maxScale": 0,
					"parentLayerId": -1,
					"defaultVisibility": True
				}, {
					"id": 1,
					"layerDefinition": {
						"source": {
							"type": "mapLayer",
							"mapLayerId": 1
},
						"drawingInfo": {
							"renderer": {
								"type": "simple",
								"label": "",
								"description": "",
								"symbol": {
									"color": [0, 0, 0, 0],
									"outline": {
										"color": [230, 230, 0, 255],
										"width": 0.39975000000000005,
										"type": "esriSLS",
										"style": "esriSLSSolid"
},
									"type": "esriSFS",
									"style": "esriSFSSolid"
}
}
}
},
					"name": "Census Block Group",
					"minScale": 1000000,
					"maxScale": 0,
					"parentLayerId": -1,
					"defaultVisibility": True
				}, {
					"id": 2,
					"layerDefinition": {
						"source": {
							"type": "mapLayer",
							"mapLayerId": 2
},
						"drawingInfo": {
							"renderer": {
								"type": "simple",
								"label": "",
								"description": "",
								"symbol": {
									"color": [0, 0, 0, 0],
									"outline": {
										"color": [230, 230, 0, 255],
										"width": 0.5625,
										"type": "esriSLS",
										"style": "esriSLSSolid"
},
									"type": "esriSFS",
									"style": "esriSFSSolid"
}
}
}
},
					"name": "Detailed Counties",
					"minScale": 0,
					"maxScale": 0,
					"parentLayerId": -1,
					"defaultVisibility": True
				}, {
					"id": 3,
					"layerDefinition": {
						"source": {
							"type": "mapLayer",
							"mapLayerId": 3
},
						"drawingInfo": {
							"renderer": {
								"type": "simple",
								"label": "",
								"description": "",
								"symbol": {
									"color": [0, 0, 0, 0],
									"outline": {
										"color": [230, 230, 0, 255],
										"width": 2,
										"type": "esriSLS",
										"style": "esriSLSSolid"
},
									"type": "esriSFS",
									"style": "esriSFSSolid"
}
}
}
},
					"name": "states",
					"minScale": 0,
					"maxScale": 0,
					"parentLayerId": -1,
					"defaultVisibility": True
}
			]
}
],
	"baseMap": {
		"baseMapLayers": [{
				"id": "labels",
				"layerType": "ArcGISTiledMapServiceLayer",
				"url": "https://services.arcgisonline.com/arcgis/rest/services/Canvas/World_Dark_Gray_Base/MapServer",
				"visibility": True,
				"opacity": 1,
				"title": "World_Dark_Gray_Base"
			}, {
				"id": "base",
				"layerType": "ArcGISTiledMapServiceLayer",
				"url": "https://services.arcgisonline.com/arcgis/rest/services/Canvas/World_Dark_Gray_Reference/MapServer",
				"visibility": True,
				"opacity": 1,
				"title": "World_Dark_Gray_Reference"
}
],
		"title": "Basemap"
},
"spatialReference": {
		"wkid": 102100,
		"latestWkid": 3857
},
	"authoringApp": "WebMapViewer",
	"authoringAppVersion": "10.6.1",
	"version": "2.11"
}
- 新しいマップを作成します。
item_properties_dict = {"type": "Web Map","title": "Test Map","tags": ["test","test1","test2"],"snippet":"This is a snippet", "text":data}

newmap = gis.content.add(item_properties = item_properties_dict)
newmap
以下に、完全なスクリプトを示します。
from arcgis.gis import GIS
from arcgis.mapping import WebMap


gis = GIS("https://earl.esri.com/portal","siteadmin","siteadmin", verify_cert=False)
print ("Successfully Logged Into GIS: ", gis)

data = {
	"operationalLayers": [{
			"id": "layer_2382",
			"layerType": "ArcGISMapServiceLayer",
			"url": "https://sampleserver6.arcgisonline.com/arcgis/rest/services/Census/MapServer",
			"visibility": True,
			"opacity": 1,
			"title": "Census Data",
			"layers": [{
					"id": 0,
					"layerDefinition": {
						"source": {
							"type": "mapLayer",
							"mapLayerId": 0
}
},
					"name": "Census Block Points",
					"minScale": 99999.99998945338,
					"maxScale": 0,
					"parentLayerId": -1,
					"defaultVisibility": True
				}, {
					"id": 1,
					"layerDefinition": {
						"source": {
							"type": "mapLayer",
							"mapLayerId": 1
},
						"drawingInfo": {
							"renderer": {
								"type": "simple",
								"label": "",
								"description": "",
								"symbol": {
									"color": [0, 0, 0, 0],
									"outline": {
										"color": [230, 230, 0, 255],
										"width": 0.39975000000000005,
										"type": "esriSLS",
										"style": "esriSLSSolid"
},
									"type": "esriSFS",
									"style": "esriSFSSolid"
}
}
}
},
					"name": "Census Block Group",
					"minScale": 1000000,
					"maxScale": 0,
					"parentLayerId": -1,
					"defaultVisibility": True
				}, {
					"id": 2,
					"layerDefinition": {
						"source": {
							"type": "mapLayer",
							"mapLayerId": 2
},
						"drawingInfo": {
							"renderer": {
								"type": "simple",
								"label": "",
								"description": "",
								"symbol": {
									"color": [0, 0, 0, 0],
									"outline": {
										"color": [230, 230, 0, 255],
										"width": 0.5625,
										"type": "esriSLS",
										"style": "esriSLSSolid"
},
									"type": "esriSFS",
									"style": "esriSFSSolid"
}
}
}
},
					"name": "Detailed Counties",
					"minScale": 0,
					"maxScale": 0,
					"parentLayerId": -1,
					"defaultVisibility": True
				}, {
					"id": 3,
					"layerDefinition": {
						"source": {
							"type": "mapLayer",
							"mapLayerId": 3
},
						"drawingInfo": {
							"renderer": {
								"type": "simple",
								"label": "",
								"description": "",
								"symbol": {
									"color": [0, 0, 0, 0],
									"outline": {
										"color": [230, 230, 0, 255],
										"width": 2,
										"type": "esriSLS",
										"style": "esriSLSSolid"
},
									"type": "esriSFS",
									"style": "esriSFSSolid"
}
}
}
},
					"name": "states",
					"minScale": 0,
					"maxScale": 0,
					"parentLayerId": -1,
					"defaultVisibility": True
}
			]
}
],
	"baseMap": {
		"baseMapLayers": [{
				"id": "labels",
				"layerType": "ArcGISTiledMapServiceLayer",
				"url": "https://services.arcgisonline.com/arcgis/rest/services/Canvas/World_Dark_Gray_Base/MapServer",
				"visibility": True,
				"opacity": 1,
				"title": "World_Dark_Gray_Base"
			}, {
				"id": "base",
				"layerType": "ArcGISTiledMapServiceLayer",
				"url": "https://services.arcgisonline.com/arcgis/rest/services/Canvas/World_Dark_Gray_Reference/MapServer",
				"visibility": True,
				"opacity": 1,
				"title": "World_Dark_Gray_Reference"
}
],
		"title": "Basemap"
},
"spatialReference": {
		"wkid": 102100,
		"latestWkid": 3857
},
	"authoringApp": "WebMapViewer",
	"authoringAppVersion": "10.6.1",
	"version": "2.11"
}

item_properties_dict = {"type": "Web Map","title": "Test Map","tags": ["test","test1","test2"],"snippet":"This is a snippet", "text":data}

newmap = gis.content.add(item_properties = item_properties_dict)
newmap
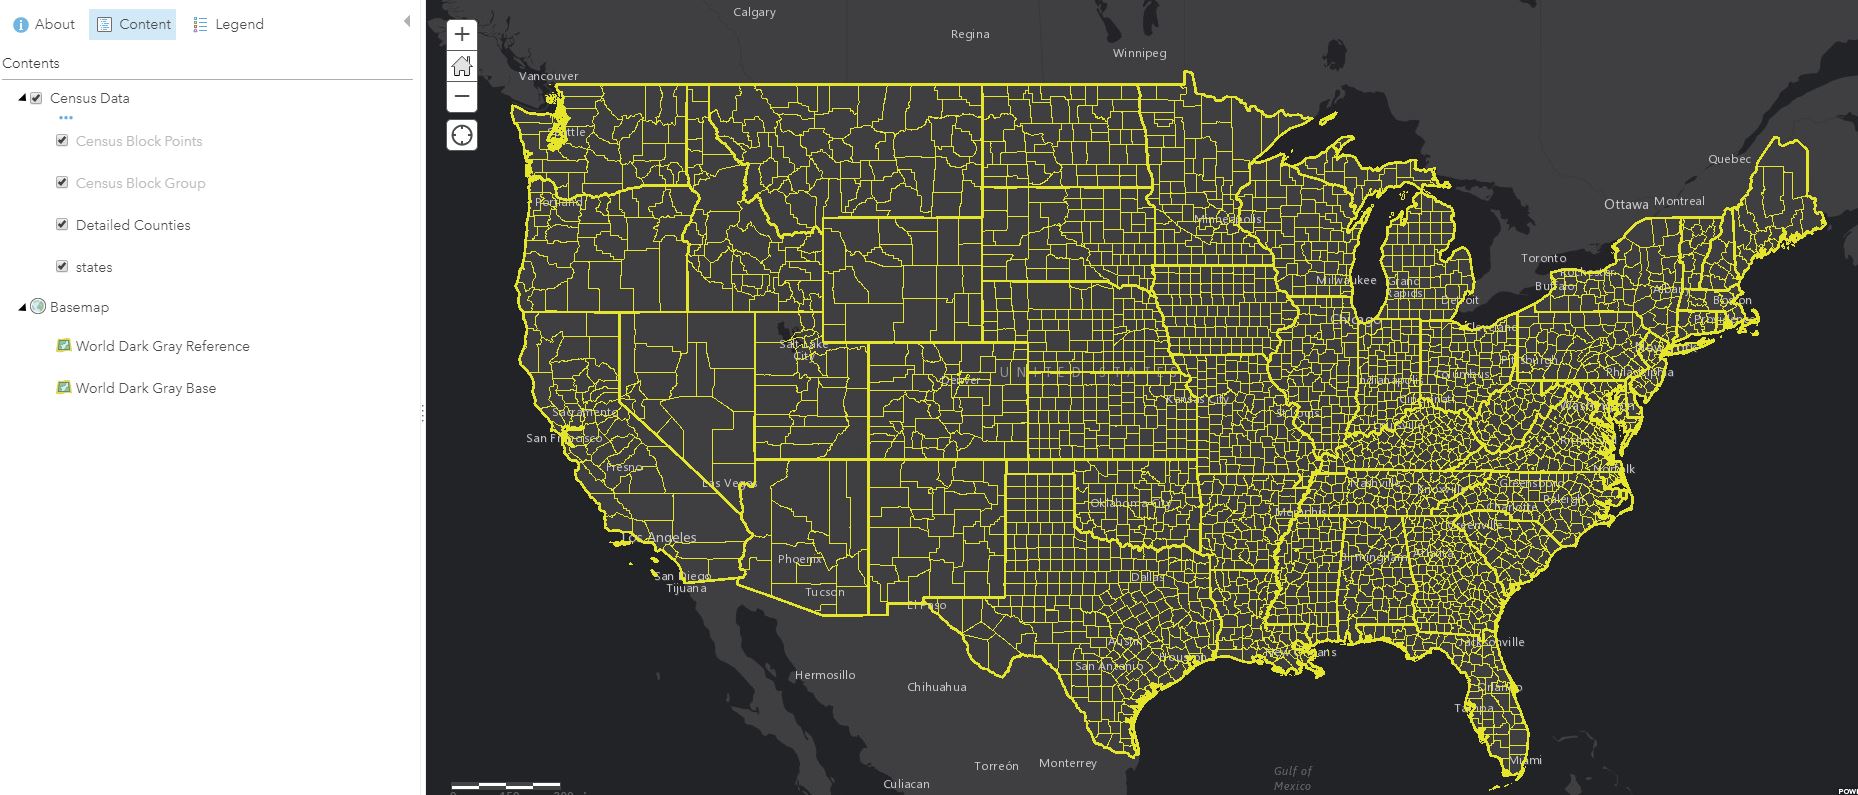
以下の画像は、新しく作成された Web マップです。
記事 ID: 000019701
AI によるサポートを受ける
Esri サポート AI チャットボットを使用して問題を迅速に解決します。


関連情報
このトピックについてさらに調べる
Search for related information
Find training related to this topic
Explore ideas and give feedback
ArcGIS エキスパートのサポートを受ける
今すぐチャットを開始