CÓMO
Cómo crear un mapa web a partir de un archivo JSON con ArcGIS API for Python
Resumen
En algunos casos, es preferible crear un mapa web mediante un script, ya que se puede programar para varios mapas web. Al utilizar la definición especificada en un archivo JSON, se puede utilizar la función gis.content.add de ArcGIS API for Python para crear el mapa web.
Procedimiento
Es posible crear mapas web a partir de una representación de archivo JSON con la función gis.content.add en el módulo de SIG. Existen dos formas de hacerlo:
- Leer el archivo JSON dentro del script.
- Definir la descripción JSON en el script.
Nota:
Definir la descripción JSON es un proceso más largo. Sin embargo, ofrece al usuario la capacidad de modificar la representación JSON del script.
Los pasos siguientes describen cómo crear un mapa web a partir de un archivo JSON leyéndolo con el módulo JSON.
-
Importe los módulos necesarios.
from arcgis.gis import GIS
from arcgis.mapping import WebMap
import json
- Especifique las credenciales de inicio de sesión.
gis = GIS("https://machine.domain.com/portal","adminuser","adminpassword")
print ("Successfully Logged Into GIS: ", gis)
- Abra el archivo JSON.
with open('/home/jupyter/test2.json') as json_data:
	data = json.load(json_data)
- Cree el nuevo mapa.
item_properties_dict = {"type": "Web Map","title": "Test Map","tags": ["test","test1","test2"],"snippet":"This is a snippet", "text":data}

newmap = gis.content.add(item_properties = item_properties_dict)
newmap
A continuación se muestra el script completo.
from arcgis.gis import GIS
from arcgis.mapping import WebMap
import json

gis = GIS("https://machine.domain.com/portal","adminuser","adminpassword")
print ("Successfully Logged Into GIS: ", gis)

with open('/home/jupyter/test2.json') as json_data:
	data = json.load(json_data)

item_properties_dict = {"type": "Web Map","title": "Test Map","tags": ["test","test1","test2"],"snippet":"This is a snippet", "text":data}

newmap = gis.content.add(item_properties = item_properties_dict)
newmap
Los pasos siguientes describen cómo crear un mapa web definiendo la descripción JSON en el script.
- Siga los pasos 1y 2 del método descrito arriba.
- Defina el diccionario que contiene el JSON utilizado para crear el mapa web.
data = {
	"operationalLayers": [{
			"id": "layer_2382",
			"layerType": "ArcGISMapServiceLayer",
			"url": "https://sampleserver6.arcgisonline.com/arcgis/rest/services/Census/MapServer",
			"visibility": True,
			"opacity": 1,
			"title": "Census Data",
			"layers": [{
					"id": 0,
					"layerDefinition": {
						"source": {
							"type": "mapLayer",
							"mapLayerId": 0
}
},
					"name": "Census Block Points",
					"minScale": 99999.99998945338,
					"maxScale": 0,
					"parentLayerId": -1,
					"defaultVisibility": True
				}, {
					"id": 1,
					"layerDefinition": {
						"source": {
							"type": "mapLayer",
							"mapLayerId": 1
},
						"drawingInfo": {
							"renderer": {
								"type": "simple",
								"label": "",
								"description": "",
								"symbol": {
									"color": [0, 0, 0, 0],
									"outline": {
										"color": [230, 230, 0, 255],
										"width": 0.39975000000000005,
										"type": "esriSLS",
										"style": "esriSLSSolid"
},
									"type": "esriSFS",
									"style": "esriSFSSolid"
}
}
}
},
					"name": "Census Block Group",
					"minScale": 1000000,
					"maxScale": 0,
					"parentLayerId": -1,
					"defaultVisibility": True
				}, {
					"id": 2,
					"layerDefinition": {
						"source": {
							"type": "mapLayer",
							"mapLayerId": 2
},
						"drawingInfo": {
							"renderer": {
								"type": "simple",
								"label": "",
								"description": "",
								"symbol": {
									"color": [0, 0, 0, 0],
									"outline": {
										"color": [230, 230, 0, 255],
										"width": 0.5625,
										"type": "esriSLS",
										"style": "esriSLSSolid"
},
									"type": "esriSFS",
									"style": "esriSFSSolid"
}
}
}
},
					"name": "Detailed Counties",
					"minScale": 0,
					"maxScale": 0,
					"parentLayerId": -1,
					"defaultVisibility": True
				}, {
					"id": 3,
					"layerDefinition": {
						"source": {
							"type": "mapLayer",
							"mapLayerId": 3
},
						"drawingInfo": {
							"renderer": {
								"type": "simple",
								"label": "",
								"description": "",
								"symbol": {
									"color": [0, 0, 0, 0],
									"outline": {
										"color": [230, 230, 0, 255],
										"width": 2,
										"type": "esriSLS",
										"style": "esriSLSSolid"
},
									"type": "esriSFS",
									"style": "esriSFSSolid"
}
}
}
},
					"name": "states",
					"minScale": 0,
					"maxScale": 0,
					"parentLayerId": -1,
					"defaultVisibility": True
}
			]
}
],
	"baseMap": {
		"baseMapLayers": [{
				"id": "labels",
				"layerType": "ArcGISTiledMapServiceLayer",
				"url": "https://services.arcgisonline.com/arcgis/rest/services/Canvas/World_Dark_Gray_Base/MapServer",
				"visibility": True,
				"opacity": 1,
				"title": "World_Dark_Gray_Base"
			}, {
				"id": "base",
				"layerType": "ArcGISTiledMapServiceLayer",
				"url": "https://services.arcgisonline.com/arcgis/rest/services/Canvas/World_Dark_Gray_Reference/MapServer",
				"visibility": True,
				"opacity": 1,
				"title": "World_Dark_Gray_Reference"
}
],
		"title": "Basemap"
},
"spatialReference": {
		"wkid": 102100,
		"latestWkid": 3857
},
	"authoringApp": "WebMapViewer",
	"authoringAppVersion": "10.6.1",
	"version": "2.11"
}
- Cree el nuevo mapa.
item_properties_dict = {"type": "Web Map","title": "Test Map","tags": ["test","test1","test2"],"snippet":"This is a snippet", "text":data}

newmap = gis.content.add(item_properties = item_properties_dict)
newmap
A continuación se muestra el script completo.
from arcgis.gis import GIS
from arcgis.mapping import WebMap


gis = GIS("https://earl.esri.com/portal","siteadmin","siteadmin", verify_cert=False)
print ("Successfully Logged Into GIS: ", gis)

data = {
	"operationalLayers": [{
			"id": "layer_2382",
			"layerType": "ArcGISMapServiceLayer",
			"url": "https://sampleserver6.arcgisonline.com/arcgis/rest/services/Census/MapServer",
			"visibility": True,
			"opacity": 1,
			"title": "Census Data",
			"layers": [{
					"id": 0,
					"layerDefinition": {
						"source": {
							"type": "mapLayer",
							"mapLayerId": 0
}
},
					"name": "Census Block Points",
					"minScale": 99999.99998945338,
					"maxScale": 0,
					"parentLayerId": -1,
					"defaultVisibility": True
				}, {
					"id": 1,
					"layerDefinition": {
						"source": {
							"type": "mapLayer",
							"mapLayerId": 1
},
						"drawingInfo": {
							"renderer": {
								"type": "simple",
								"label": "",
								"description": "",
								"symbol": {
									"color": [0, 0, 0, 0],
									"outline": {
										"color": [230, 230, 0, 255],
										"width": 0.39975000000000005,
										"type": "esriSLS",
										"style": "esriSLSSolid"
},
									"type": "esriSFS",
									"style": "esriSFSSolid"
}
}
}
},
					"name": "Census Block Group",
					"minScale": 1000000,
					"maxScale": 0,
					"parentLayerId": -1,
					"defaultVisibility": True
				}, {
					"id": 2,
					"layerDefinition": {
						"source": {
							"type": "mapLayer",
							"mapLayerId": 2
},
						"drawingInfo": {
							"renderer": {
								"type": "simple",
								"label": "",
								"description": "",
								"symbol": {
									"color": [0, 0, 0, 0],
									"outline": {
										"color": [230, 230, 0, 255],
										"width": 0.5625,
										"type": "esriSLS",
										"style": "esriSLSSolid"
},
									"type": "esriSFS",
									"style": "esriSFSSolid"
}
}
}
},
					"name": "Detailed Counties",
					"minScale": 0,
					"maxScale": 0,
					"parentLayerId": -1,
					"defaultVisibility": True
				}, {
					"id": 3,
					"layerDefinition": {
						"source": {
							"type": "mapLayer",
							"mapLayerId": 3
},
						"drawingInfo": {
							"renderer": {
								"type": "simple",
								"label": "",
								"description": "",
								"symbol": {
									"color": [0, 0, 0, 0],
									"outline": {
										"color": [230, 230, 0, 255],
										"width": 2,
										"type": "esriSLS",
										"style": "esriSLSSolid"
},
									"type": "esriSFS",
									"style": "esriSFSSolid"
}
}
}
},
					"name": "states",
					"minScale": 0,
					"maxScale": 0,
					"parentLayerId": -1,
					"defaultVisibility": True
}
			]
}
],
	"baseMap": {
		"baseMapLayers": [{
				"id": "labels",
				"layerType": "ArcGISTiledMapServiceLayer",
				"url": "https://services.arcgisonline.com/arcgis/rest/services/Canvas/World_Dark_Gray_Base/MapServer",
				"visibility": True,
				"opacity": 1,
				"title": "World_Dark_Gray_Base"
			}, {
				"id": "base",
				"layerType": "ArcGISTiledMapServiceLayer",
				"url": "https://services.arcgisonline.com/arcgis/rest/services/Canvas/World_Dark_Gray_Reference/MapServer",
				"visibility": True,
				"opacity": 1,
				"title": "World_Dark_Gray_Reference"
}
],
		"title": "Basemap"
},
"spatialReference": {
		"wkid": 102100,
		"latestWkid": 3857
},
	"authoringApp": "WebMapViewer",
	"authoringAppVersion": "10.6.1",
	"version": "2.11"
}

item_properties_dict = {"type": "Web Map","title": "Test Map","tags": ["test","test1","test2"],"snippet":"This is a snippet", "text":data}

newmap = gis.content.add(item_properties = item_properties_dict)
newmap
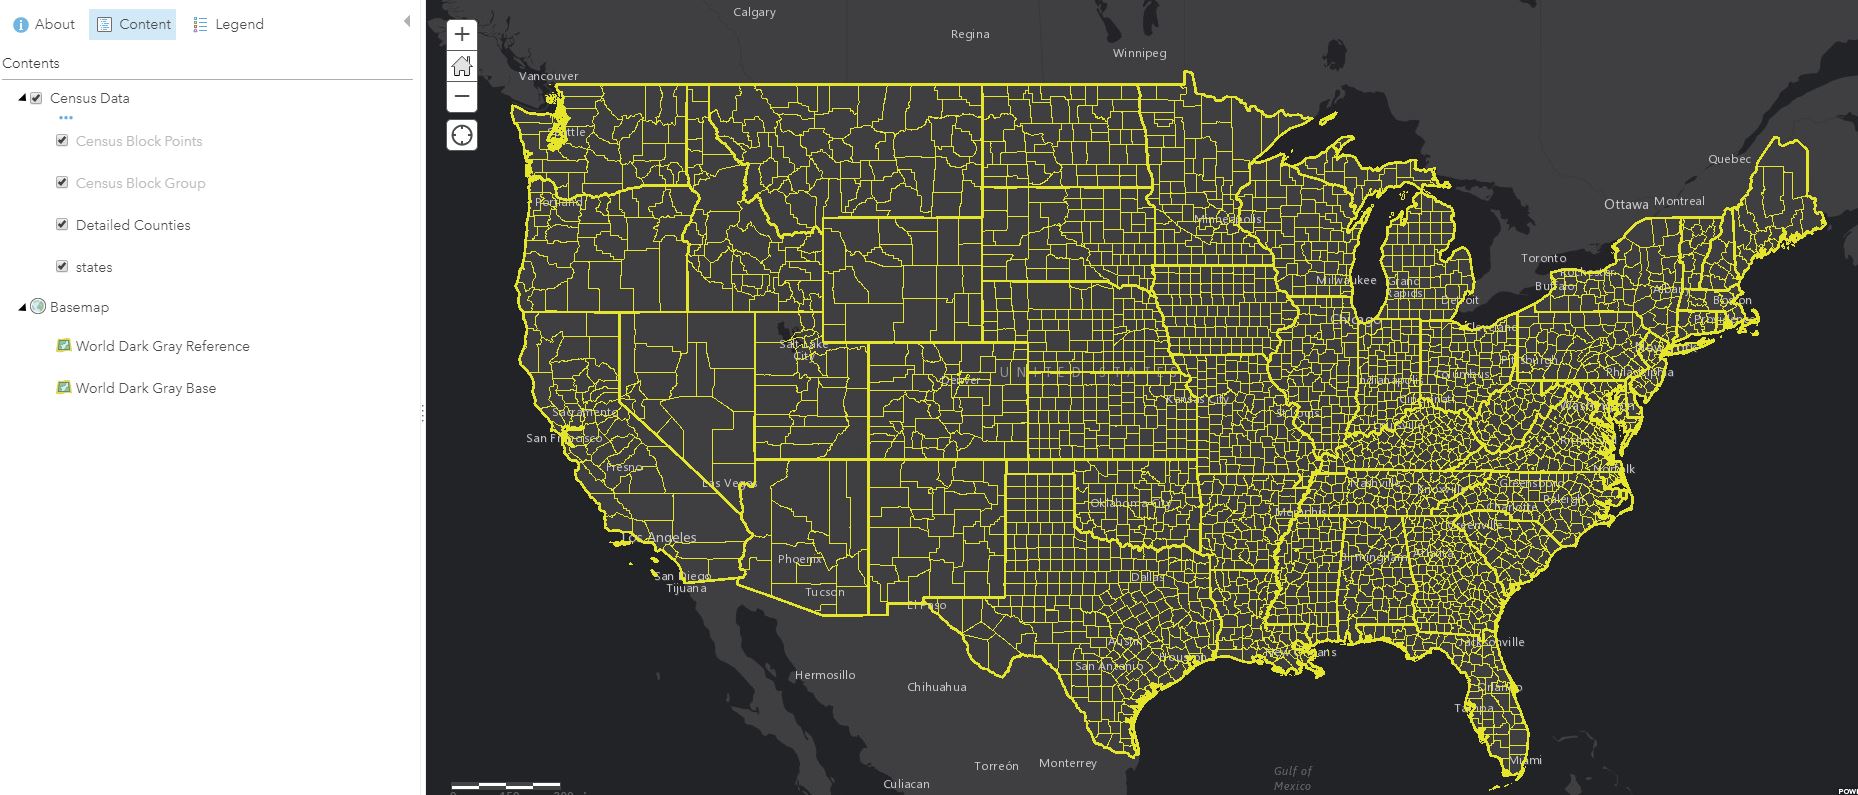
La siguiente imagen es el mapa web que acaba de crear.
Id. de artículo: 000019701
Obtenga soporte con IA
Resuelva su problema rápidamente con el chatbot de inteligencia artificial de soporte de Esri.


Información relacionada
Descubrir más sobre este tema
Search for related information
Find training related to this topic
Explore ideas and give feedback
Obtener ayuda de expertos en ArcGIS
Empieza a chatear ahora