HOW TO
Create a list, pie chart, and serial chart with only distinct features from a table in ArcGIS Dashboards
Summary
In ArcGIS Dashboards, Arcade expressions can be used to customize how the data points render for the list, and pie chart elements. Depending on how the element is configured, a data point can represent a feature or a summary statistic.
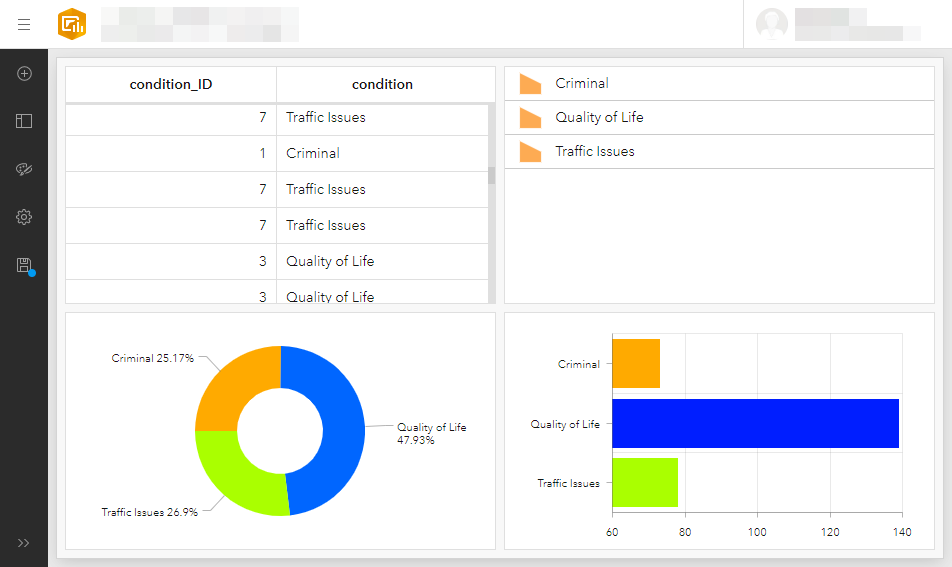
This article provides the steps to generate distinct features from a table and display them in a list, pie chart, and serial chart for better clarity. The image below displays a list and a pie chart of incidents by condition.
Procedure
- Open the ArcGIS Dashboards item. Click Add element on the dashboard toolbar and place an element in the dashboard.
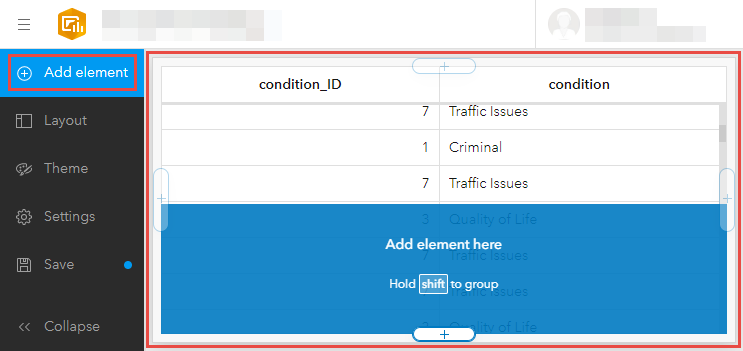
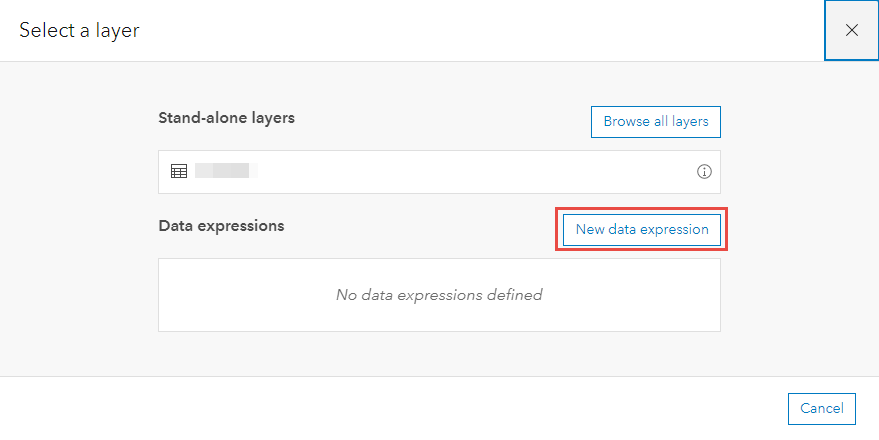
- Select List for creating a new list, Pie chart for creating a new pie chart, or Serial chart for creating a new serial chart, and click New data expression.
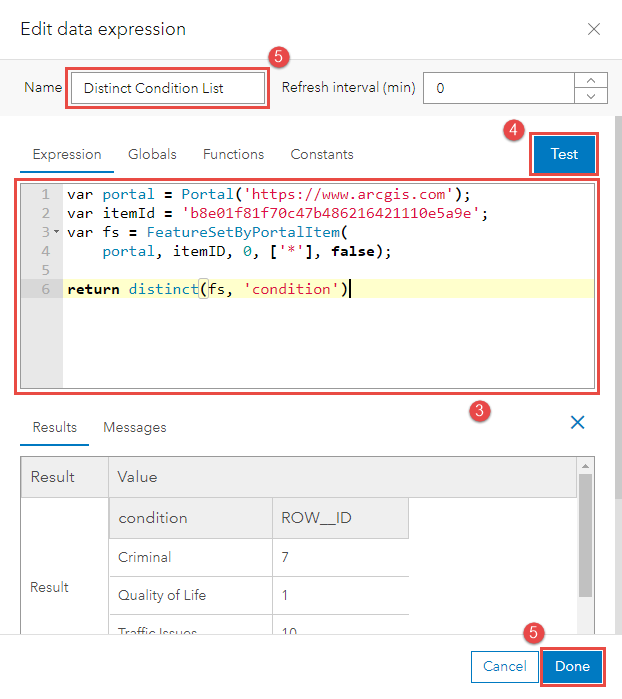
- Specify the following Arcade expression in the Expression window.
- Arcade expression for the list element:
var portal = Portal('<portal_URL>');
var <variableName1> = '<itemID>';
var <variableName2> = FeatureSetByPortalItem(
    portal, <variableName1>, <sublayer_ID>, ['<field_name_1>', '<field_name_2>', ..., '<field_name_n>'], false);

return distinct(<variableName3>, '<field_name_n>')
- Arcade expression for the pie chart, and serial chart element:
var portal = Portal('<portal_URL>');
var <variableName1> = '<itemID>';
var <variableName2> = FeatureSetByPortalItem(
    portal, <variableName1>, <sublayer_ID>, ['<field_name_1>', '<field_name_2>', ..., '<field_name_n>'], false)

var <variableName4> = GroupBy(<variableName3>, distinct(['<field_name_n>']), [{
    name: '<field_name_new>',
    expression: '<field_name_n>',
    statistic: '<statistic type>'
}])

return <variableName4>
Note:
Specifying the fields and includeGeometry parameters in the FeatureSet are optional expressions for the FeatureSetByPortalItem() function. Refer to ArcGIS Arcade: FeatureSetByPortalItem for more information.
- Click Test and review the results below the Expression window.
- Specify a name for the expression and click Done.
- Generate and format the list or pie chart as required. Refer to ArcGIS Dashboards: List, ArcGIS Dashboards: Pie chart, or ArcGIS Dashboards: Serial chart for more information. Click Done.
Article ID: 000027717
- ArcGIS Online
- ArcGIS Dashboards
Get support with AI
Resolve your issue quickly with the Esri Support AI Chatbot.


Related Information
Discover more on this topic
Search for related information
Find training related to this topic
Explore ideas and give feedback
Get help from ArcGIS experts
Start chatting now