HOW TO
Create a quantitative bivariate map in ArcGIS Pro
Summary
A bivariate map illustrates two variables that are related but have different values on a map by combining different sets of symbols and colors. It serves as a simple method to illustrate the relationship, graphically and accurately, between the two variables that are spatially distributed. With this map, it is also possible to easily assess how two attributes change in relation to one another.
This article describes the options to create a quantitative bivariate map to illustrate the relationship between two variables; female life expectancy in the year 2010, and female obesity prevalence in the year 2009.
Procedure
Depending on the suitability, use one of the following options to create a quantitative bivariate map.
Draw the layer with the bivariate colors symbology
- Open the ArcGIS Pro project.
- Symbolize the feature layer with the bivariate colors symbology. Refer to ArcGIS Pro: Draw a layer with bivariate colors symbology for instructions.
- Insert a layout and map frame for the map. Refer to ArcGIS Pro: Insert a layout and ArcGIS Pro: Insert a map frame for instructions.
- In the layout view, on the top ribbon, in the Map Surrounds group, click Legend and create a legend to display the differences between the bivariate colors of the variables.
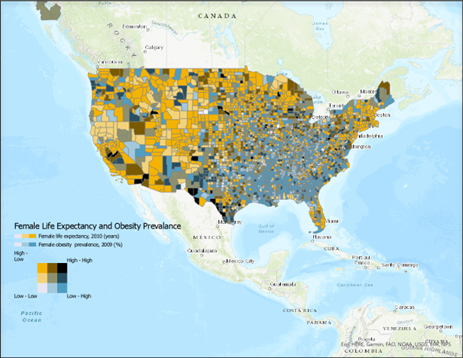
The image below shows the bivariate color representation of the different combinations between the two variables; female life expectancy in the year 2010, and female obesity prevalence in the year 2009.
Draw the layer with the dot density symbology
- Open the ArcGIS Pro project.
- Symbolize the feature layer with the dot density symbology. Refer to ArcGIS Pro: Draw a layer with dot density symbology for instructions.
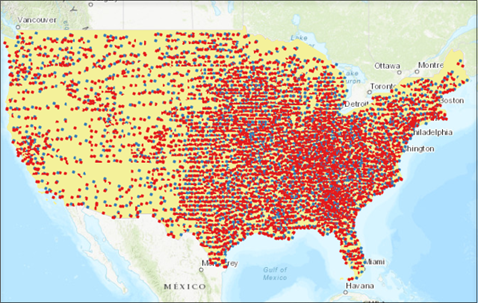
The image below shows the density of the female life expectancy in the year 2010 and female obesity prevalence in the year 2009. Each dot represents fifty percent. The red dot represents the female life expectancy in the year 2010, while the blue dot represents female obesity prevalence in the year 2009.
Draw the layers with different level of transparency
This option creates a bivariate choropleth map, which is essentially the graphical combination of two choropleth maps. Create two choropleth maps for the desired attributes using the graduated colors symbology, overlap them by positioning one layer on top of the other in the Contents pane, and apply a fifty percent transparency level to the top layer to create a bivariate map.
- Open the ArcGIS Pro project.
- Symbolize the two feature layers with the graduated colors symbology to create choropleth maps, each showing the desired variables. Refer to ArcGIS Pro: Graduated colors for instructions. Select a different color scheme for each layer to distinguish between the two variables.
- In the Contents pane, drag and drop the layers to position the desired layer on top of the other.
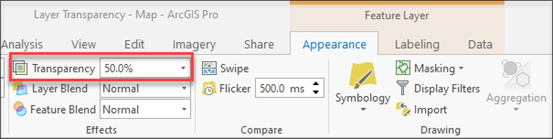
- On the top ribbon, under Feature Layer, on the Appearance tab, in the Effects group, set Transparency to fifty percent for the top layer.
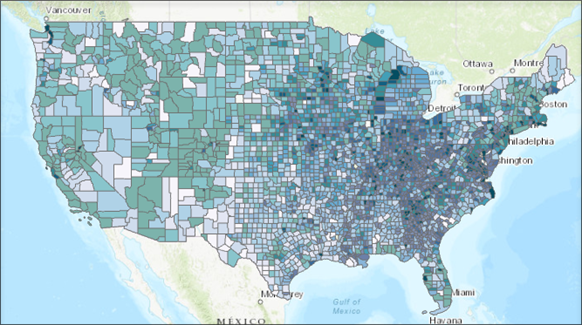
The image below shows the feature layers are drawn with different transparency levels. The layer with the transparency applied displays the female life expectancy in the year 2010, while the other displays female obesity prevalence in the year 2009.
Article ID: 000027489
- ArcGIS Pro 2 8 x
- ArcGIS Pro 2 7 x
- ArcGIS Pro 2 x
Get support with AI
Resolve your issue quickly with the Esri Support AI Chatbot.


Related Information
Discover more on this topic
Search for related information
Find training related to this topic
Explore ideas and give feedback
Get help from ArcGIS experts
Start chatting now