HOW TO
Create a slope map from contour lines in ArcGIS Pro
Summary
Contour lines are presented as line features in a shapefile or feature class (vector data) containing elevation values for each line. The image below shows an example of contour lines.
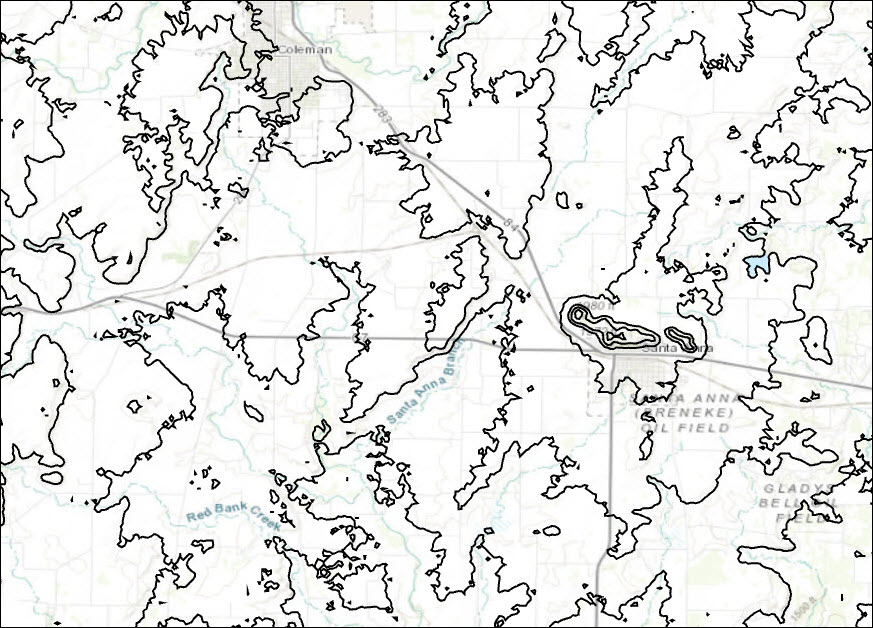
In some instances, these lines must be converted to a slope map for slope analysis. This article provides instructions to create a slope map from contour lines.
Procedure
To convert the contour lines to a slope map, they must be converted to a digital elevation model (DEM) using the Topo to Raster tool. The DEM data are converted to a slope map using the Slope tool.
Note:
The Topo to Raster and Slope tool require a Spatial Analyst or 3D Analyst license.
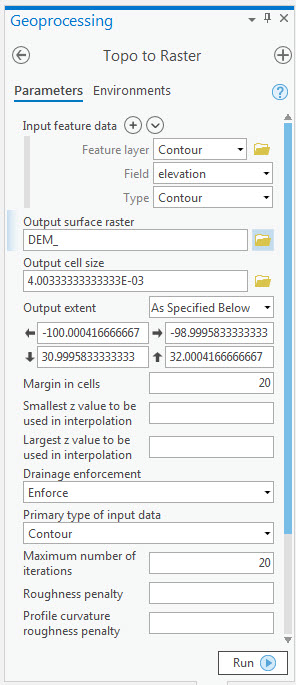
- Convert the contour layer to a DEM using the Topo to Raster tool.
- For Input feature data, select the contour layer for Feature layer, select the field containing the elevation values for Field, and select Contour for Type.
- Set a name and location for Output surface raster.
- Type the desired Output cell size or accept the default.
- Set other parameters as desired, and click Run.
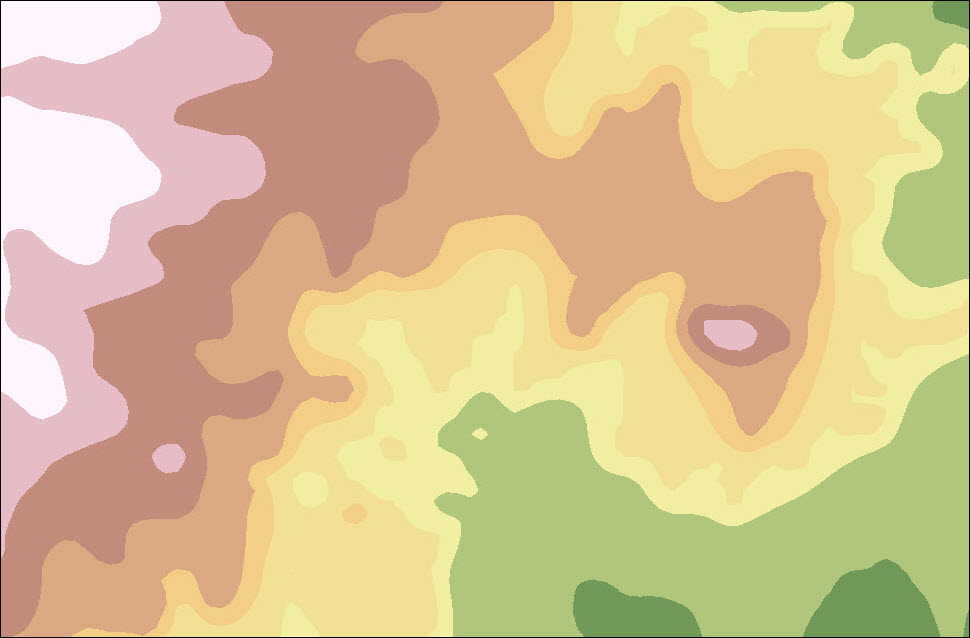
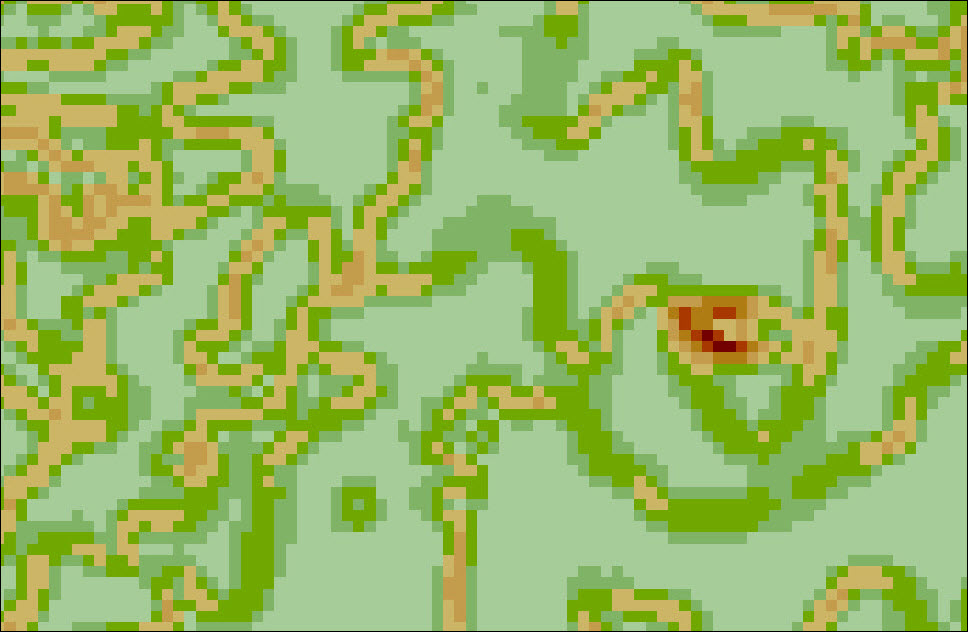
The image below shows a DEM created from the contour lines.
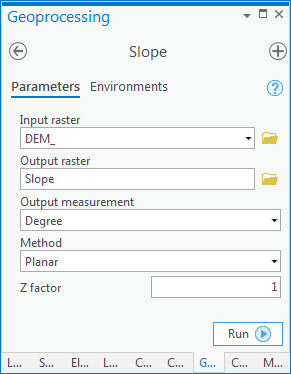
- Create a slope map from the DEM layer using the Slope tool.
- Select the created DEM layer for Input raster.
- Set a name and location for Output raster.
- Select the desired Output measurement. In this example, Degree is selected.
- Set other parameters as desired, and click Run.
Article ID: 000023285
- ArcGIS Pro 2 x
Get support with AI
Resolve your issue quickly with the Esri Support AI Chatbot.


Related Information
Discover more on this topic
Search for related information
Find training related to this topic
Explore ideas and give feedback
Get help from ArcGIS experts
Start chatting now