Frequently asked question
Does ArcGIS Flight support thermal inspections?
The ArcGIS Flight application can accept input from a Zenmuse XT2 thermal camera when using the DJI M200 V1 and V2 series of drones. This article outlines various thermal color palettes, isotherms and other considerations when performing thermal measurements of both points and areas.
Thermal inspection using drones is increasing in popularity and can be used in a variety of applications, from construction and engineering to scientific investigation. As the ArcGIS Flight app is designed to accept specific models of drones and their associated cameras, it is important to understand the camera the ArcGIS Flight app currently accepts, along with the drones to which this camera can be mounted. An overview of the thermal tools and settings is provided to facilitate the use of this camera.
ArcGIS Flight thermal inspections
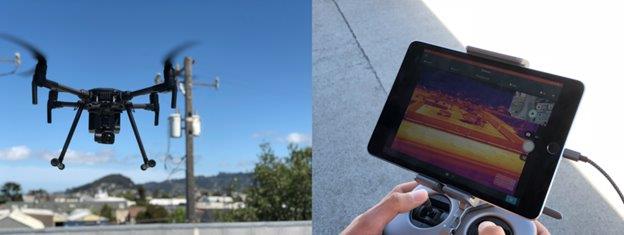
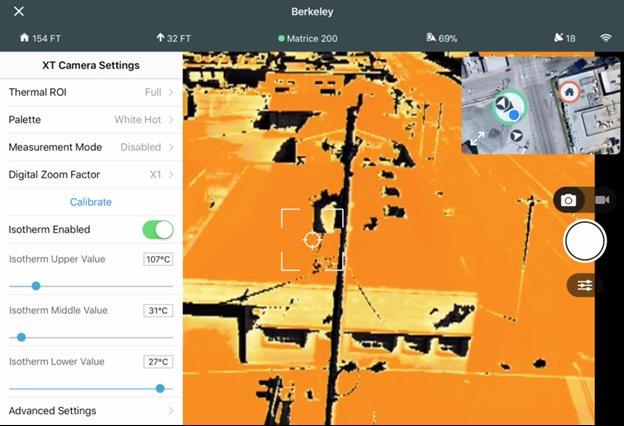
When flying any of the DJI M200 series drones—the M200, M210, or the M210 RTK, the Zenmuse XT2 thermal camera, powered by FLIR, is fully compatible with ArcGIS Flight’s inspection mode. It is possible to perform thermal flights for a variety of use cases, such as understanding flooding impact, heat loss, concrete curing, solar panel productivity, or inspecting critical infrastructures such as power lines, bridges, and so forth. All thermal settings and tools can be accessed by tapping the settings button below the circular shutter release button while flying an inspection.
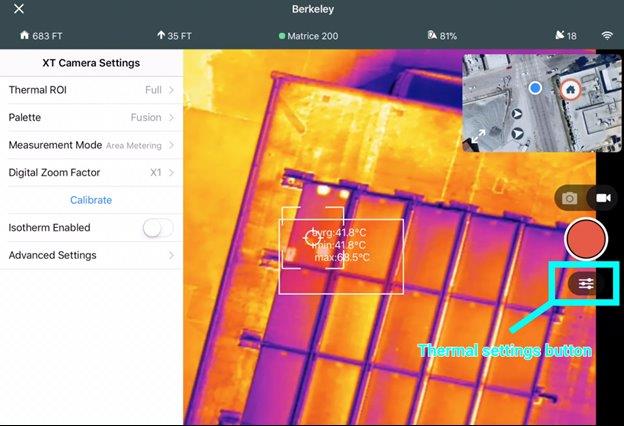
Thermal settings button
This article discusses four main concepts:
- Palettes
- Point measurements
- Area measurements
- Isotherms
Palettes
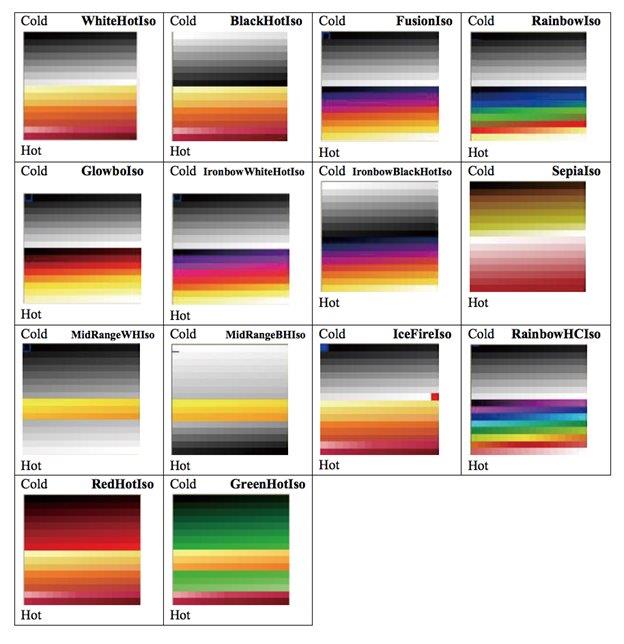
The three most common palettes are white hot, black hot, and fusion. Palettes are used to visualize temperature during the flight and assign certain temperature ranges to specific colors. When using the White Hot palette, the photos captured show hot areas in white. Examples of color palettes are shown below.
Color palettes
Spot meter
Solar array spot metering measurement
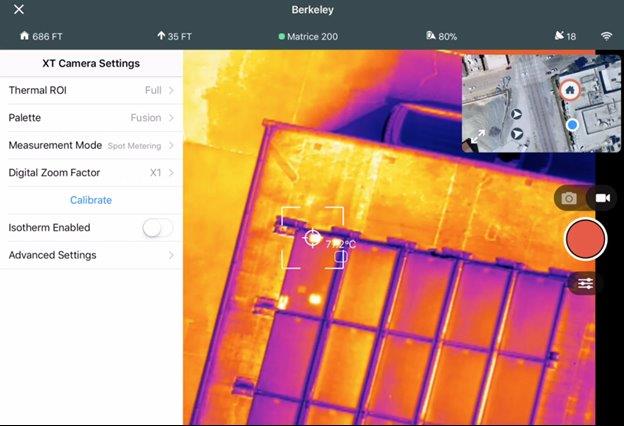
The Zenmuse XT2 Radiometric model thermal camera can measure the temperature for any area in an image with an accuracy of ±10 degree Celsius. When environmental conditions are ideal, the camera provides an accuracy of ±5 degree Celsius.
The Zenmuse XT2 Performance model can also measure the average temperature of the 4×4 pixels in the center of an image with an accuracy of ±20 degree Celsius in High Gain mode, and an accuracy of 20 percent of the entire temperature range or 20 degree Celsius (whichever is greater) in Low Gain mode.
Area measurement
Enabling this function displays the average temperature, lowest temperature, the highest temperature and the corresponding locations of each area. The full screen view is also supported.
The spot meter’s measurement accuracy is affected by various factors:
- The reflectivity of objects – shiny metals with high reflectivity reflect more of the background radiation, and result in a larger error; objects with matte surfaces produce higher accuracy.
- The temperature of background radiation – a sunny day without clouds has less of an effect on accuracy than a cloudy day.
- Air temperature and humidity – the higher the temperature and humidity, the lower the accuracy.
- Distance between camera and object – the shorter the distance, the higher the accuracy.
- The emissivity of objects – the higher the emissivity, the higher the accuracy.
Isotherm
Enabling Isotherm allows designated temperature ranges to be represented with different color schemes, so that objects measured in a single color scheme impart higher contrast and better visibility. Individual isotherms (or color schemes) are separated by upper, middle and lower thresholds, which have a value in percentage or temperature.
Take the White Hot Isotherm as an example. Below the lower threshold, 128-Grayscale is used to represent temperature differences.
- Between the lower and middle thresholds, Color Scheme 1 (48-Isotherm) is used.
- Between the middle and upper thresholds, Color Scheme 2 (48-Isotherm) is used.
- Above the upper threshold, Color Scheme 3 (32-Isotherm) is used. White-hot isotherm Isotherm settings
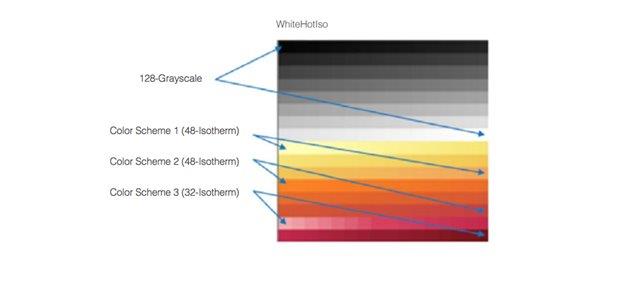
Below is an image showing the White Hot Isotherm.
Article ID: 000023060
- Mobile Applications
Get support with AI
Resolve your issue quickly with the Esri Support AI Chatbot.


Discover more on this topic
Search for related information
Find training related to this topic
Explore ideas and give feedback
Get help from ArcGIS experts
Start chatting now