HOW TO
Create contour lines in ArcGIS Pro
Summary
Contour lines help visualize surface topology by creating line connecting points with an equal elevation above or below a standard level. This is useful in identifying suitable locations for projects, such as estimating water storage capacity, or approximating the volume of excavation work. In ArcGIS Pro, existing tools and functions can be used to create contour lines, depending on the input and the desired output data. The table below lists the tools and functions to create a contour layer.
| Tool or function | Contour function | Contour tool | Surface Contour tool |
| Input data | Single-band raster layer | Raster layer | TIN or LAS dataset |
| Output data | Raster layer | Line feature class | Line feature class |
| Data of contour lines are available in the attribute table? | No | Yes | Yes |
| Extension | None | 3D Analyst or Spatial Analyst | 3D Analyst |
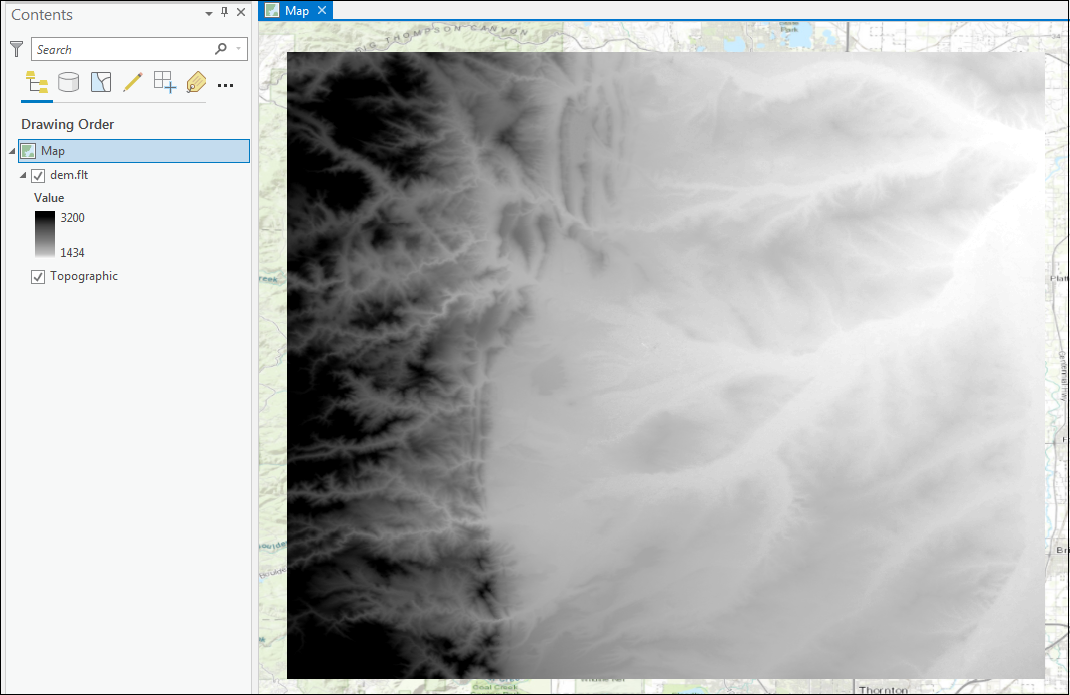
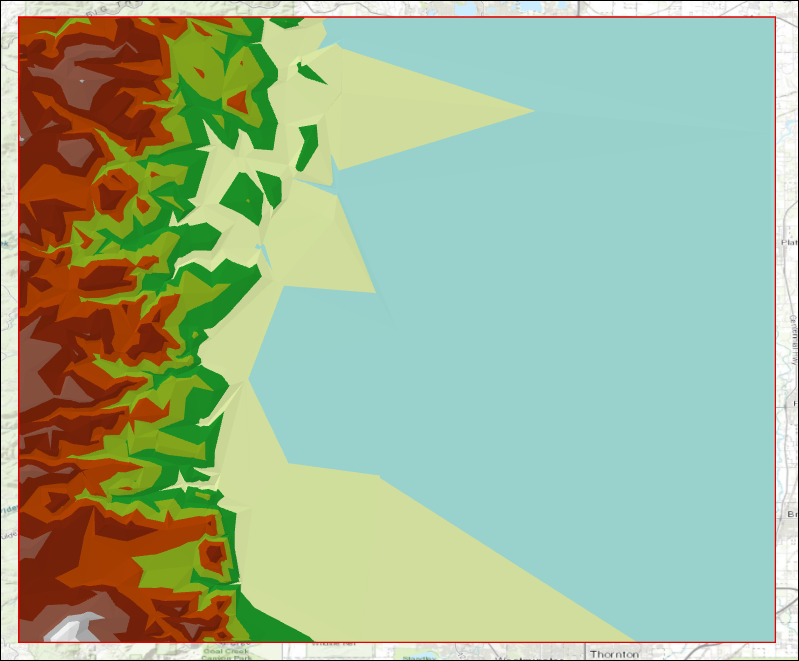
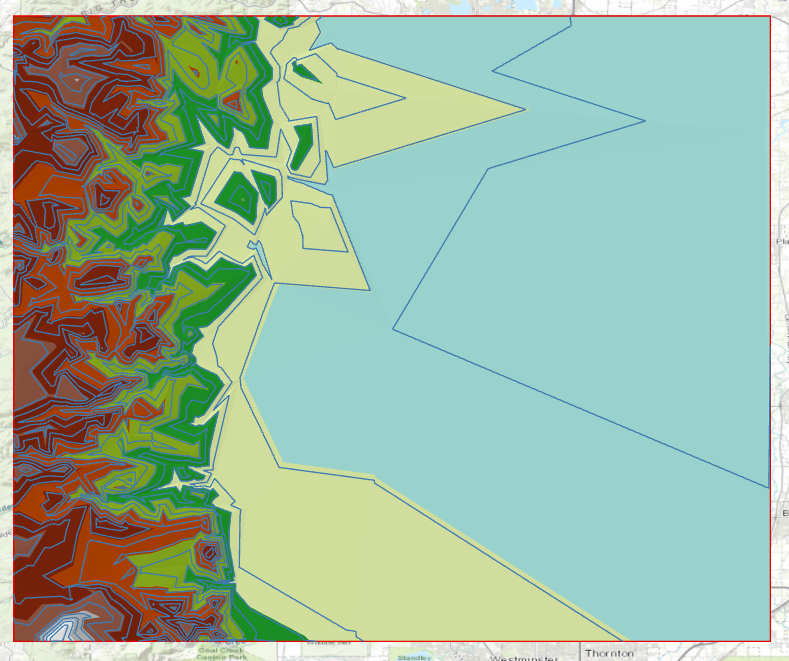
The images below show a digital elevation model (DEM) and triangulated irregular network (TIN) layer of Boulder, Colorado and its surrounding area. The study area shows elevations between 1,434 and 3,200 meters above sea level. A contour layer with 100-meter intervals is drawn on the map.
DEM layer of Boulder, Colorado and its surrounding area.
TIN layer of Boulder, Colorado and its surrounding area.
Procedure
Depending on the input and desired output data, select a method to create contour lines in ArcGIS Pro.
Use the Contour function
Contour function creates a raster contour output. A better visualization is returned using this method as the Adaptive Smoothing property is applied to the output raster. In ArcGIS Pro, Contour function is available under Raster functions, which is accessible either on the Analysis or the Imagery tab.
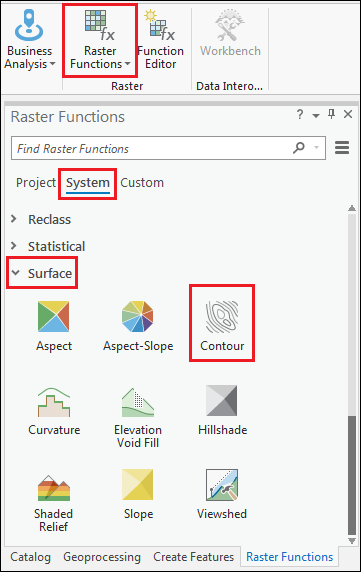
- In ArcGIS Pro, select either the Analysis or the Imagery tab. Click Raster Functions.
- In the Raster Functions pane, click System > Surface > Contour.
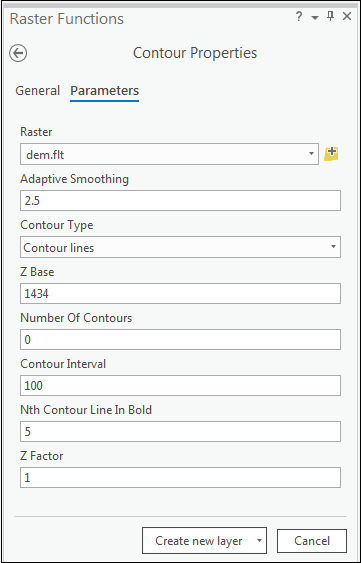
- Configure the Contour Properties pane. Refer to ArcGIS Pro: Contour function - Parameters for more information on parameter settings.
- For Raster, specify the desired single-band raster layer. In this example, it is dem.flt.
- For Contour Type, ensure the default Contour lines option is selected.
- For Z Base, specify the base contour value. In this example, it is 1,434 meters, as this is the lowest elevation in the study area.
Note:
The default value of Z Base is 0, which represents the mean sea level. For a study area with a minimum elevation of 1,434 meters and a contour interval of 100, maintaining the default Z Base value creates increments of 100s, starting from the next nearest hundredth, that is, 1,500, 1,600, 1,700, and so forth. If Z Base is specified as 1,434, the 100 increment starts from this value, that is, 1,534, 1,634, 1,734, and so forth.
- Specify either the Number Of Contours or Contour Interval field to determine the space between two contour lines. In this example, Contour Interval is specified as 100.
Note:
Define the space between two contour lines using either the static (by specifying the Contour Interval field) or dynamic (by specifying the Number of Contours field) value.
- Click Create new layer.
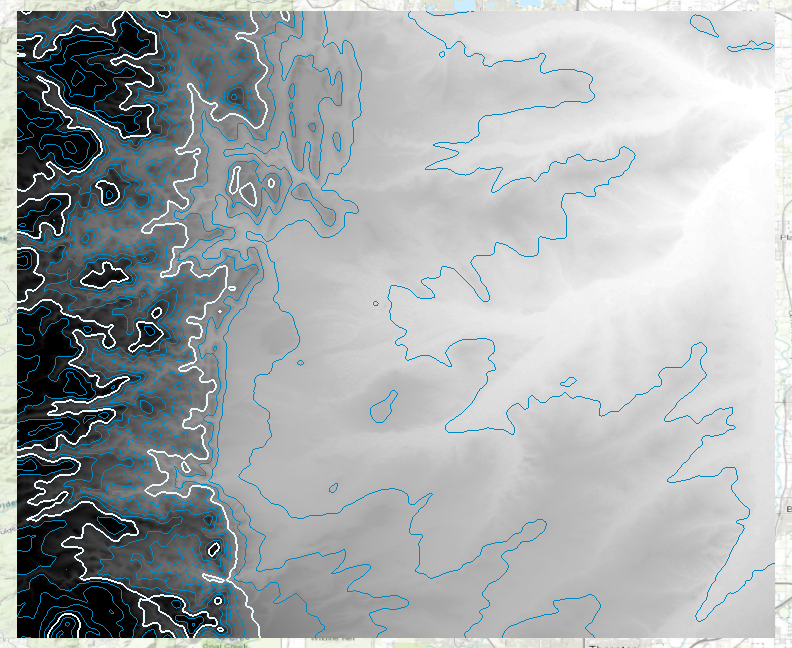
The image below shows a raster contour layer with 100-meter contour intervals starting from a 1,434-meter elevation, with every fifth contour line in bold.
Use the Contour tool
The Contour tool creates contour features from a raster surface. For more information on how the tool works, refer to ArcGIS Pro: How Contouring works.
Note:
• To create contour lines for specific elevations, use the Contour List tool.
• To create contour lines with the presence of barriers, use the Contour with Barriers tool.
- In ArcGIS Pro, select the Analysis tab and click Tools.
- In the Geoprocessing pane, search for Contour.
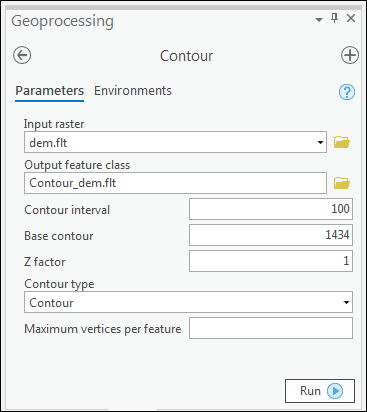
- Configure the Contour pane. For more information on the parameters, refer to ArcGIS Pro: Contour - Syntax.
- For Input raster, select the input surface raster. In this example, it is dem.flt.
- For Contour interval, specify the space between two contour lines. In this example, it is 100 meters.
- For Base contour, specify the base contour value. In this example, it is 1,434 meters, as this is the lowest elevation in the study area.
- For Contour type, ensure the default Contour option is selected.
- Click Run.
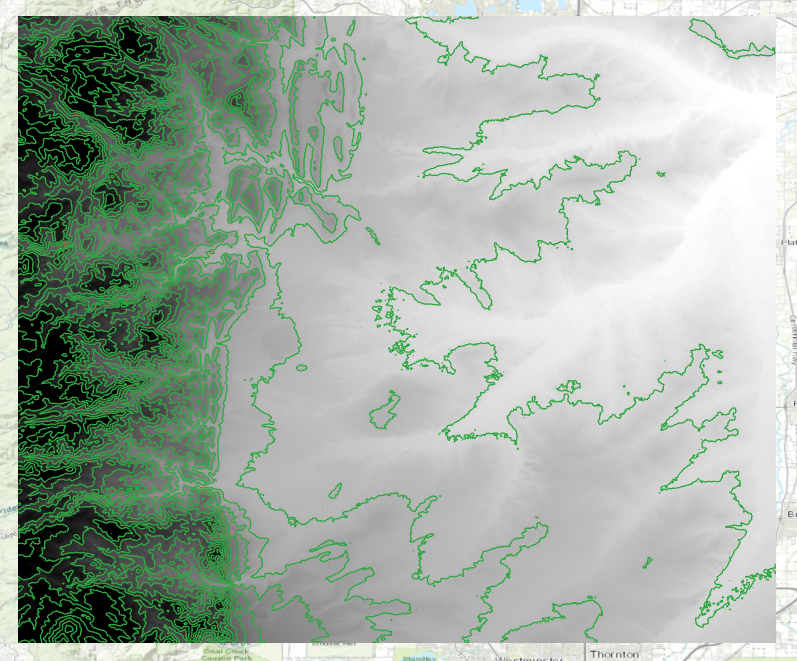
The image below shows a contour layer with 100-meter contour intervals starting from a 1,434-meter elevation.
Use the Surface Contour tool
The Surface Contour tool creates contour features from a TIN or LAS dataset surface. For more information on how the tool works, refer to ArcGIS Pro: How Surface Contour works.
- In ArcGIS Pro, select the Analysis tab and click Tools.
- In the Geoprocessing pane, search for Surface Contour.
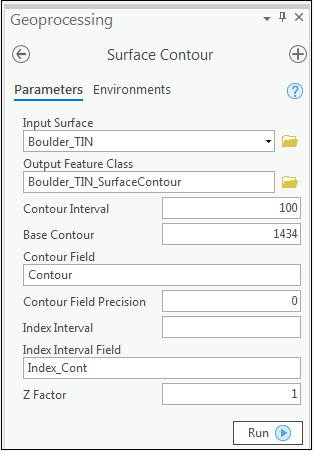
- Configure the Surface Contour pane. For more information on the parameters, refer to ArcGIS Pro: Surface Contour - Syntax.
- For Input Surface, specify the TIN, LAS, or terrain dataset. In this example, it is Boulder_TIN.
- For Contour Interval, specify the space between two contour lines. In this example, it is 100 meters.
- For Base Contour, specify the base contour value. In this example, it is 1,434 meters, as this is the lowest elevation in the study area.
- Click Run.
The image below shows a contour layer with 100-meter contour intervals starting from a 1,434-meter elevation.
Article ID: 000022519
- ArcGIS Pro 2 x
Get support with AI
Resolve your issue quickly with the Esri Support AI Chatbot.


Related Information
Discover more on this topic
Search for related information
Find training related to this topic
Explore ideas and give feedback
Get help from ArcGIS experts
Start chatting now