HOW TO
Extract raster values to point locations in ArcMap
Summary
Raster values, such as elevation, velocity, and temperature, are extracted to point features to identify geographic data at specific point locations. For example, to determine the volume of rainfall at designated catchment areas; to identify the elevation of each station in a topographic survey, or to determine the water velocity at each detection buoy in a tsunami identification system.
In ArcMap, there are multiple methods to determine the raster values at point locations. The table below summarizes the tools that can be used depending on the desired input and output data. For more information, refer to ArcGIS Blog: How to extract raster values at point locations?
| Tool | Extract Values to Points | Extract Multi Values to Points | Sample | Add Surface Information | Extract Values To Table |
| Input raster: Number of raster layer | One | One or multiple | One or multiple | One | One or multiple |
| Input location data | Point feature class | Point feature class | Point feature class or another raster | Point, multipoint, line, or polygon feature class | Point or polygon feature class |
| Output location of the extracted raster values | A new feature class | Raster values appended to the input point layer | A new table | Raster values appended to the input layer | A new table |
| Extension | Spatial Analyst | Spatial Analyst | Spatial Analyst | 3D Analyst | Geostatistical Analyst |
In 1994, a 6.7 magnitude earthquake occurred in the Northridge neighborhood of the Los Angeles county, claiming 57 lives. This incident is used as an example in this article.
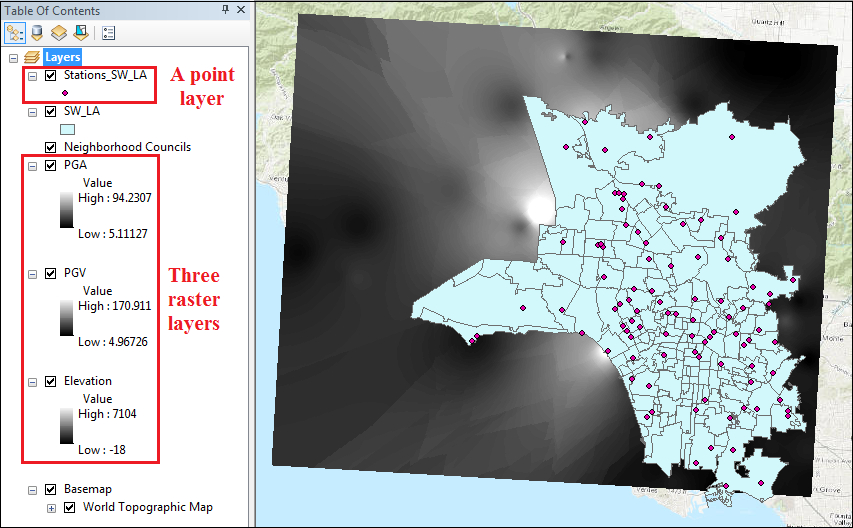
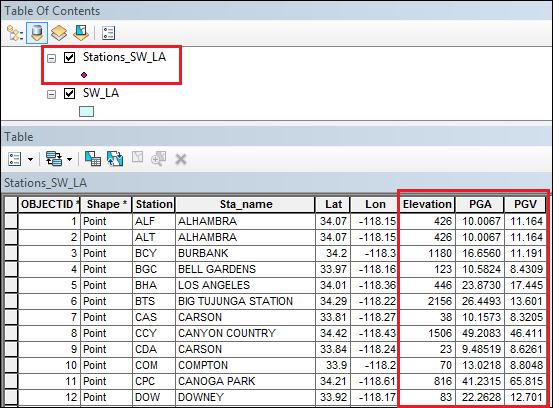
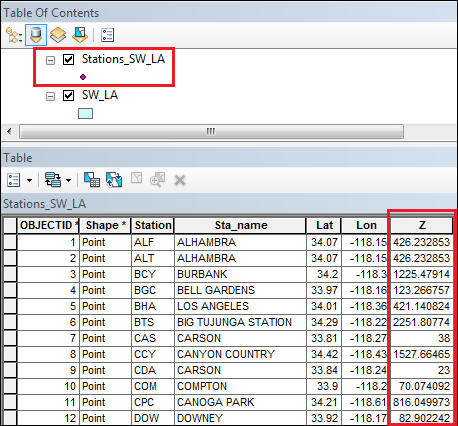
The peak ground acceleration (PGA) and peak ground velocity (PGV) of the earthquake are determined at all earthquake ground stations across California. The image below shows three single-band raster layers; Elevation, PGA, and PGV, representing the elevation data and earthquake properties studied. A point feature class named Stations_SW_LA shows the locations of 98 earthquake stations across southwest Los Angeles.
This article describes methods to extract values of the raster layers to each station location.
Procedure
Use any of the tools below to extract raster values to point locations in ArcMap.
Note:
Use the necessary geoprocessing tools to convert data from other formats, such as TIN, to raster before using any of the methods below.
Extract Values to Points
Use the Extract Values to Points tool to create a new point feature class containing the extracted values of a raster layer.
- In ArcMap, click the Search icon and search for Extract Values to Points (Spatial Analyst).
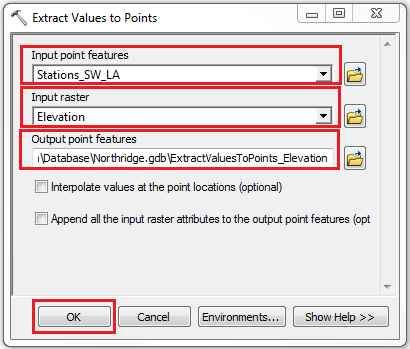
- In the Extract Values to Points dialog box, configure as follows:
- For Input point features, select the point layer. In this example, it is Stations_SW_LA.
- For Input raster, select a raster layer. In this example, it is Elevation.
- For Output point features, set a name and location for the output feature class.
- Click OK.
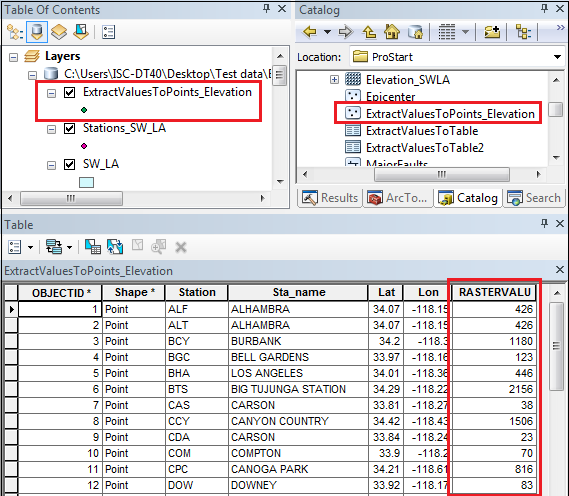
The image below shows a new point feature class is created in the geodatabase and Table Of Contents. In the attribute table, a RASTERVALU column is created to show the extracted raster value for every point feature.
Extract Multi Values to Points
Use the Extract Multi Values to Points tool to append the extracted values of multiple raster layers to the input point layer.
- In ArcMap, click the Search icon and search for Extract Multi Values to Points (Spatial Analyst).
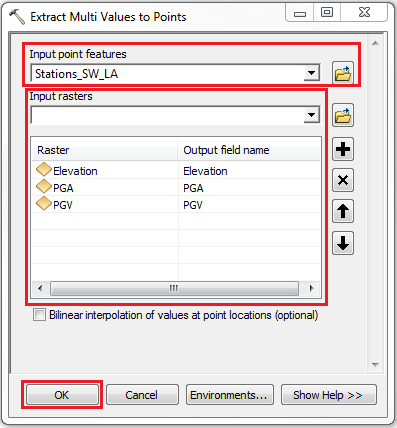
- In the Extract Multi Values to Points dialog box, configure as follows:
- For Input point features, select the point layer. In this example, it is Stations_SW_LA.
- For Input rasters, select multiple raster layers. In this example, they are Elevation, PGA, and PGV.
- Click OK.
The image below shows values from the specified three raster layers appended to the input point layer.
Sample
Use the Sample tool to create a new table containing information of the input point features and their respective raster values based on a resampling technique.
- In ArcMap, click the Search icon and search for Sample (Spatial Analyst).
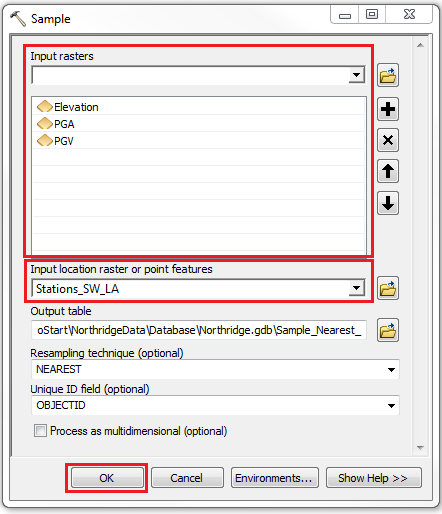
- In the Sample dialog box, configure as follows:
- For Input rasters, select the desired raster layers. In this example, they are Elevation, PGA, and PGV.
- For Input location raster or point features, select the point layer. In this example, it is Stations_SW_LA.
- Configure the optional values if necessary. Click OK.
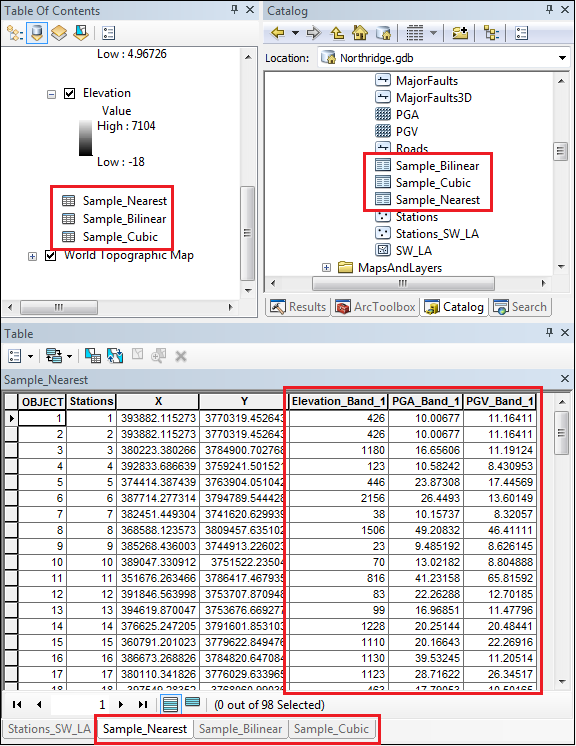
The image below shows raster values are extracted to each point feature in a table added in the geodatabase and Table Of Contents. In this example, the tool is run multiple times using three resampling techniques: Nearest, Bilinear, and Cubic.
Add Surface Information
Use the Add Surface Information tool to append values of a raster layer to the input point layer.
- In ArcMap, click the Search icon and search for Add Surface Information (3D Analyst).
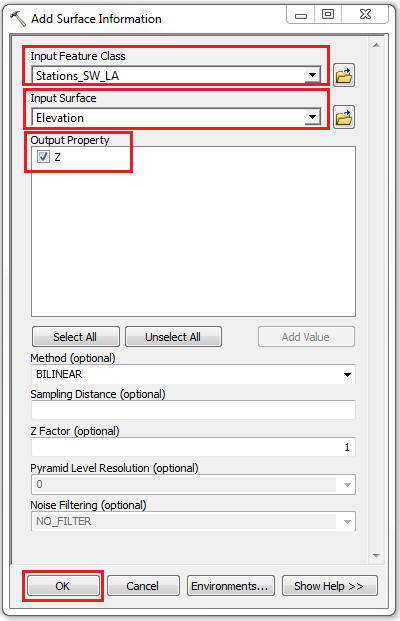
- In the Add Surface Information dialog box, configure as follows:
- For Input Feature Class, select the point layer. In this example, it is Stations_SW_LA.
- For Input Surface, select a raster layer. In this example, it is Elevation.
- For Output Property, select the attribute to append. In this example, it is the Z value.
- Configure the optional values if necessary. Click OK.
The image below shows the selected attribute of the raster layer is appended to the input point layer.
Extract Values To Table
Use the Extract Values To Table tool to create a new table containing information of the input point features and their respective raster values.
- In ArcMap, click the Search icon and search for Extract Values To Table (Geostatistical Analyst).
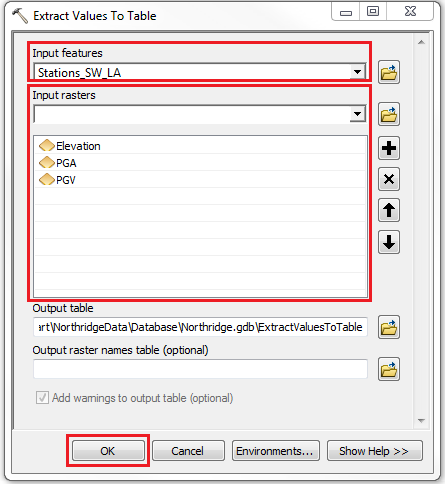
- In the Extract Values To Table dialog box, configure as follows:
- For Input features, select the point layer. In this example, it is Stations_SW_LA.
- For Input rasters, select the desired raster layers. In this example, they are Elevation, PGA, and PGV.
- Click OK.
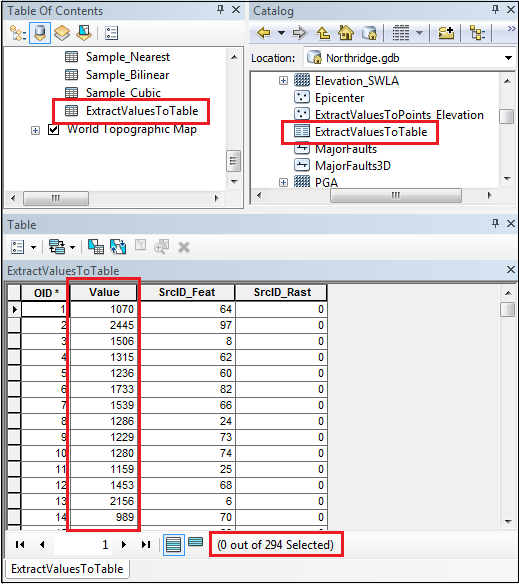
The image below shows the output table containing the extracted raster values for each point feature in the geodatabase and Table Of Contents. In this example, note that the total features is 294 instead of 98. The value of each raster layer (three raster layers are run) for each point feature is listed with a different OID value. This is the transposed version of the Sample tool output table. To understand how value extraction works using the Geostatistical Analyst extension, refer to How Extract Values To Table works and How Gaussian Geostatistical Simulations works.
Article ID: 000022163
- ArcMap
Get support with AI
Resolve your issue quickly with the Esri Support AI Chatbot.


Related Information
Discover more on this topic
Search for related information
Find training related to this topic
Explore ideas and give feedback
Get help from ArcGIS experts
Start chatting now