HOW TO
Show related records in ArcGIS Dashboards
Summary
Related records are secondary data that have relationships with the primary data. However, unlike join tables, related records are not appended to the primary data. So, the related table is viewed separately from the primary attribute table.
The table below shows the primary data and related records (secondary data) of three postgraduate students, and the number of fossils collected from central Peninsular Malaysia. Data are collected using an ArcGIS Survey123 form with multiple repeat records.
| Primary data: Paleontology report | Name | Nelisa | Syahida | Nisa | ||||||
| Field supervisor | Prof. Shafeea | Prof. Aziz | Prof. Kamal | |||||||
| Date of fieldwork | 31/8/2019 | 30/8/2019 | 30/8/2019 | |||||||
| Base camp location | Lipis town | Temerloh | Jengka town | |||||||
| Geologic age | Late Permian | Middle - Late Triassic | Late Triassic | |||||||
| Geologic Formation | Gua Musang | Semantan | Kerum | |||||||
| Secondary data (Related records): Paleontology report - fossils | Fieldwork location | Gua Bama | Kechau | Merapoh | Mentakab | Chenor | Bera | Jengka | Kuala Krau | Jerantut |
| Brachiopod | 26 | 21 | 19 | 13 | 18 | 30 | 18 | 30 | 22 | |
| Bivalve | 18 | 28 | 17 | 20 | 17 | 21 | 12 | 28 | 20 | |
| Cephalopod | 6 | 8 | 11 | 6 | 7 | 8 | 8 | 5 | 3 | |
| Porifera | 12 | 2 | 0 | 5 | 6 | 5 | 3 | 5 | 0 | |
| Unidentified fossils | 27 | 31 | 12 | 18 | 19 | 28 | 20 | 22 | 27 | |
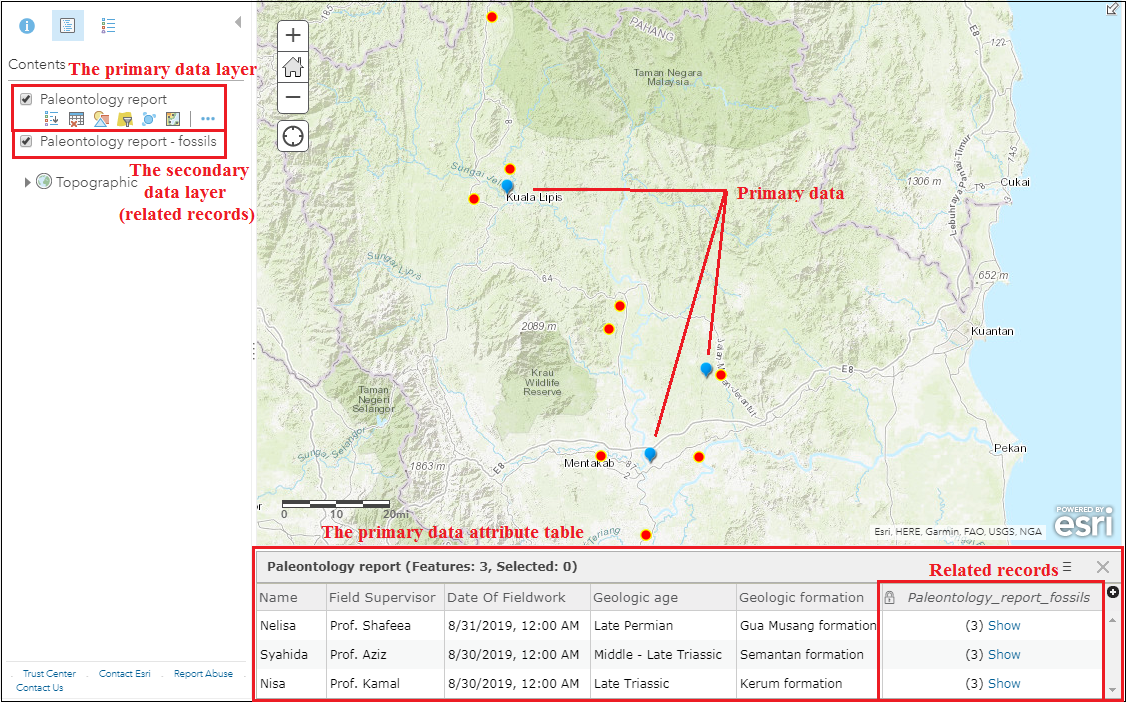
The image below shows the data collected and viewed in ArcGIS Online Map Viewer Classic. The base camp (primary data) and fieldwork (related record) locations are plotted on the map based on the answers given in the survey. Details of primary data on the fieldwork are categorized as 'Paleontology report', while related records on the number of fossils collected are categorized as 'Paleontology report - fossils'. A dashboard is created from Map Viewer Classic for display and visualization purposes.
Procedure
Use any of the workarounds below to view related records in ArcGIS Dashboards.
Use the List or Details element and configure layer actions for map interactions
This option is suitable for spatial and non-spatial related records. Configuring either the List or Details element displays the related records on the dashboard. Also, configuring layer actions between dashboard elements enables interactions by triggering an event in the target element when data is selected in the source element.
Note:
Currently, ArcGIS Dashboards only supports related records at the visualization level. Querying related records is not possible.
- Click Add element in ArcGIS Dashboards, and select List.
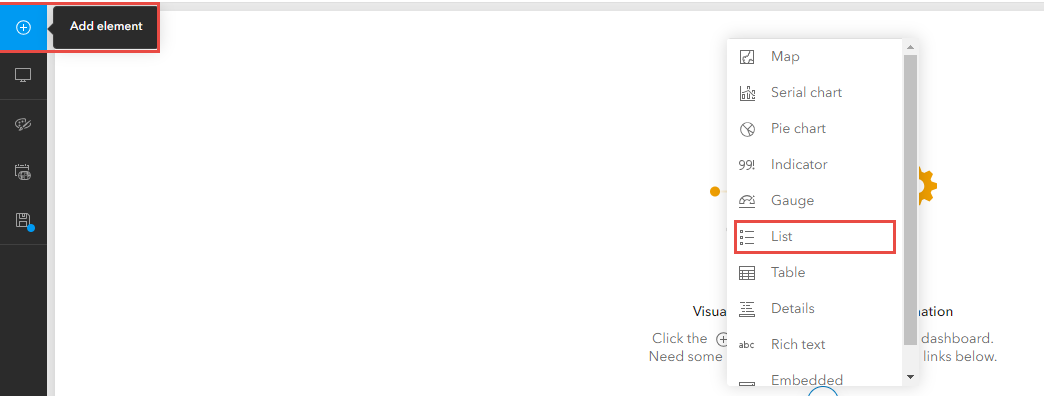
- Select the related records layer in the Select a layer window.
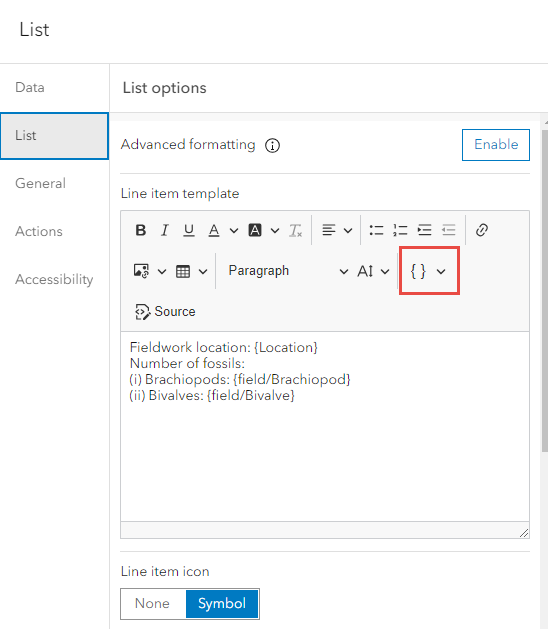
- Configure the Data tab in the List window. Specify the Filter function to constrain the amount of information to display. Specify the Maximum Features Displayed field to increase or decrease the number of features to display.
- Click the Insert drop-down button on the List tab, and choose the field values to display.
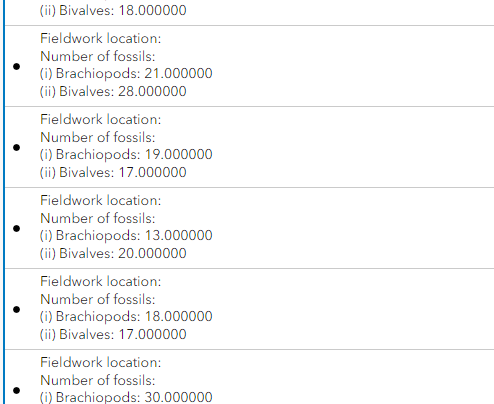
- Click Done after completing the necessary configurations. The related records are shown in the List view.
Note:
Alternatively, configure the Details element to display related records on the dashboard. Click Add element > Details, and select the related records layer. However, unlike the List element, users are unable to configure field formatting, and set the Details element as the action source.
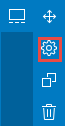
- Configure Layer actions to enable interactions between the Map and List elements. Hover over the upper left corner of the map, and select the Configure icon. Refer to ArcGIS Dashboards: Configure actions for elements for more information.
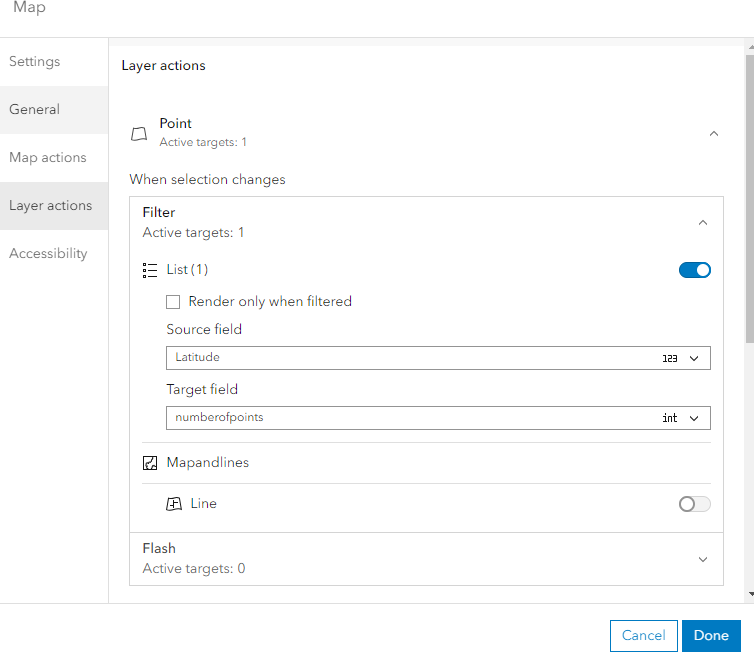
- Select the Layer actions tab in the Map window. Expand the desired section for the type of action. In this example, the Filter section is enabled.
- Select the common attribute that links both fields for Source field and Target field.
- Click Done.
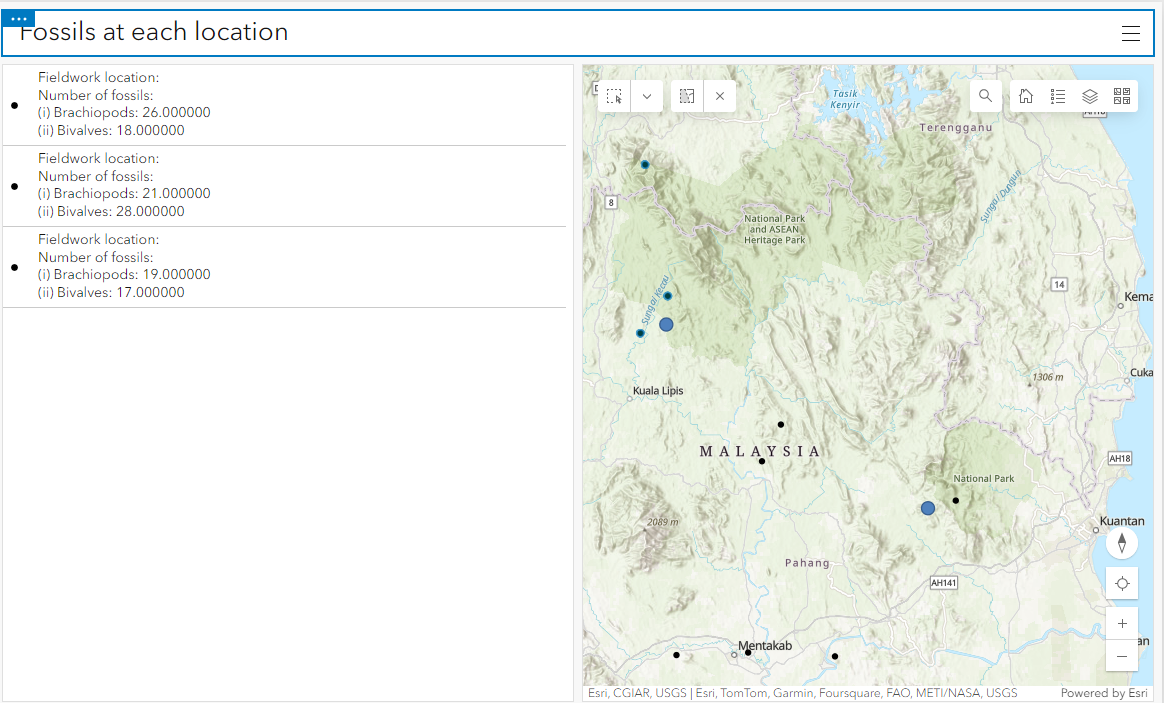
The Map element is linked to the List element. Based on the image below, clicking a primary data shows only the related records associated with the primary data. Three records out of nine related records appear in the List element (target field) when one data in the Map element (source field) is selected.
Note:
It is possible to set the List element as the source field, and the Map element as the target field. This way, clicking the data in the related records List element flashes or zooms to the location of the data on the Map element. Refer to ArcGIS Dashboards: Configure actions for elements for more information on using widgets as source or target actions.
Configure a survey to have a geopoint question within each repeat and show the related records as pop-ups in ArcGIS Dashboards
This method is suitable for spatial related records. Creating a survey form in ArcGIS Survey123 Connect with a geopoint question in each repeat simplifies visualization of the related record on Map Viewer, and on ArcGIS Dashboards.
Note:
Nested repeats cannot be viewed on ArcGIS Online Map Viewer and other related web apps, including ArcGIS Dashboards.
- Create a survey using an Advanced template in ArcGIS Survey123 Connect.
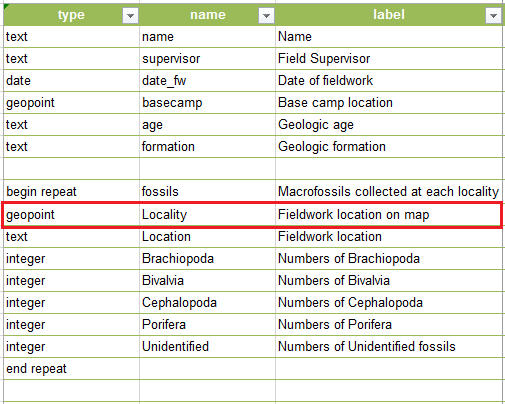
- Configure a survey containing a geopoint question within a repeat. This example shows a geopoint question, labelled Fieldwork location on map, is configured within the repeat section.
- Save the XLSForm and publish the survey.
- Open the survey in ArcGIS Online Map Viewer. By default, the locations of primary data and related records are plotted based on the geopoint answers in the surveys with the pop-up enabled. In this example, the primary data is labelled Base camp location, and the related records are labeled Fieldwork location on map.
- Navigate to the related records layer, and click the More Options icon (ellipsis) to change the pop-up display for related records. Select Configure Pop-up.
- Configure the title and Pop-up Contents sections. Click OK.
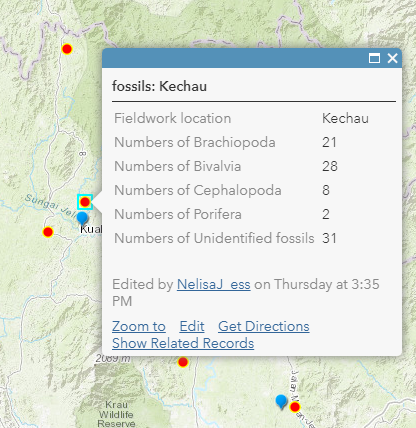
Clicking any related record on the map opens the details in the pop-up window, as shown in the image below.
- Save the web map.
- Click Share > CREATE A WEB APP. Select ArcGIS Dashboards.
- Configure the details and click DONE.
- The pop-up configured in Map Viewer is honored in ArcGIS Dashboards.
Clicking the related records on the dashboard opens the pop-up window displaying the related records.
Article ID: 000021812
- ArcGIS Dashboards
- ArcGIS Survey123 Connect
Get support with AI
Resolve your issue quickly with the Esri Support AI Chatbot.


Related Information
Discover more on this topic
Search for related information
Find training related to this topic
Explore ideas and give feedback
Get help from ArcGIS experts
Start chatting now