Frequently asked question
Why is the sum of the race categories higher than the total population in Business Analyst reports?
Answer
In Business Analyst reports that use race data, the total population listed at the top of the report is less than the sum of the race categories.
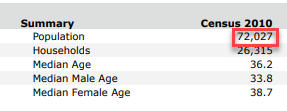
For example, in the Age by Sex by Race Profile represented in the image below, the total population within the search radius is 72,027.
However, when the total population for Hispanic, White, Black, American Indian, Asian, Pacific Islander, and Some Other Race listed in the report is calculated, it adds up to 118,822 instead.
The Business Analyst demographic reports use data from the 2010 U.S. Census that has a separate classification for race and ethnicity. According to the Census, Hispanic is treated as an ethnicity, and people who identify as Hispanic or Latino may also report as any race. This causes a discrepancy if Hispanic is calculated as a race in Business Analyst reports.
Therefore, the total population is a sum of all the race categories except for Hispanic.
Article ID:000021800
- More Products
Get help from ArcGIS experts
Download the Esri Support App
Related Information
Discover more on this topic
Search for related information
Find training related to this topic
Explore ideas and give feedback