PROBLEM
Some categories in a donut chart are not displayed in the Insights for ArcGIS workbook
Description
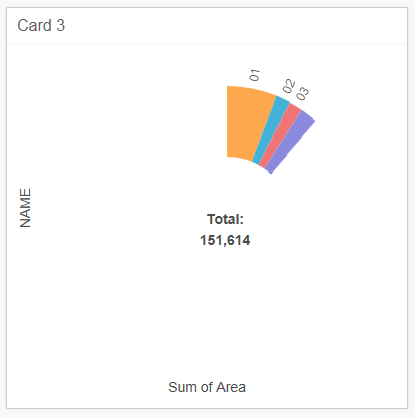
When creating a chart using the Donut Chart option in the Insights for ArcGIS workbook, some categories are not displayed in the workbook even though the total value is calculated based on the sum of all fields.
The image below shows an example of the donut chart with only a few categories displayed.
Cause
This problem occurs if some fields in the Excel file column contain null values that represent no data or no value. If a column containing null values is used to create the donut chart, it is not drawn completely.
Solution or Workaround
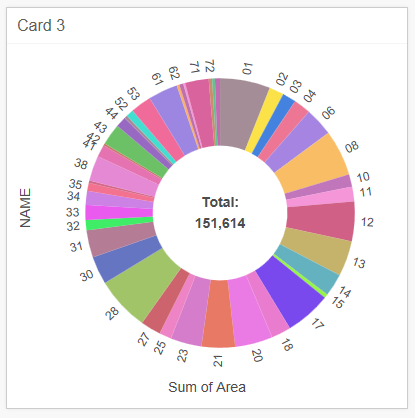
Remove the fields containing null values in the Excel file column used to create the donut chart. After removing the fields, in the Insights for ArcGIS workbook, add the Excel file using the Add button and recreate the donut chart in the workbook.
The image below shows a complete donut chart after the fields containing null values are removed.
Article ID:000021337
- ArcGIS Insights 3 3
Get help from ArcGIS experts
Download the Esri Support App
Related Information
Discover more on this topic
Search for related information
Find training related to this topic
Explore ideas and give feedback