Frequently asked question
Is it possible to capture a date range in a single date field in ArcGIS Survey123?
Answer
While it is not possible to capture a date range in a single date field in ArcGIS Survey123, it is possible to use the concat() function to store the date or time range in a single text field. The following general expression is used to capture two dates as a time range in a single text field:
concat((format-date(${start_date},'%d%m%y')), ' - ', (format-date(${end_date},'%d%m%y')))
This expression can be used in different settings as described below.
Enter the start and end dates manually
This example shows the start and end dates of an event involving multiple days, where both dates are entered manually to display the time range.
- Open ArcGIS Survey123 Connect and create a survey using the Advanced template.
- Click the Open XLSForm spreadsheet icon
 .
. - In the type column, create two date (or dateTime) fields to capture the start and end dates. In this example, they are labelled Start Time and End Time.
Note:
To hide the date fields in the attribute table, set bind::esri::fieldType to null.
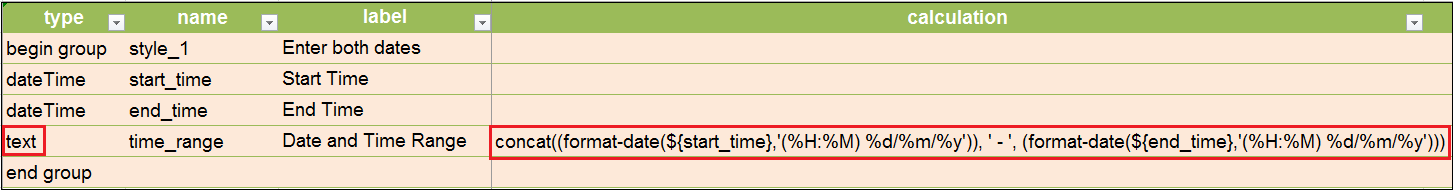
- In another row of the type column, create a text field to capture the time range. In this example, it is labelled Date and Time Range. In the calculation column, use the concat() function.
concat((format-date(${start_time},'(%H:%M) %d/%m/%y')), ' - ', (format-date(${end_time},'(%H:%M) %d/%m/%y')))
The image below shows the formula used to represent the start and end dates of an event in a text field.
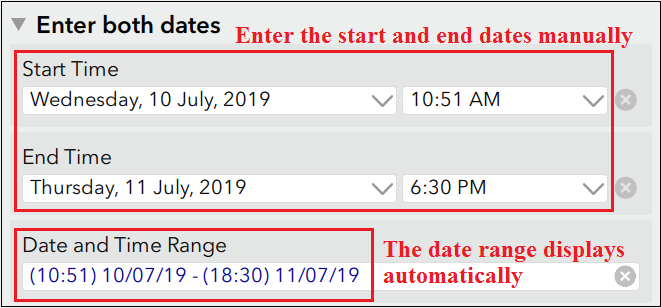
The image below shows the form created from the configured settings. Fill in both Start Time and End Time to display the Date and Time Range.
Enter the start date manually and the end date is determined automatically based on a given duration
This example shows the start date of a house lease, where the end date is determined based on the duration of the lease in an integer field.
- Open ArcGIS Survey123 Connect and create a survey using the Advanced template.
- Click the Open XLSForm spreadsheet icon
 .
. - In the type column, create a date field to capture the start date. In this example, it is labelled, Start lease.
- In another row, create an integer field to capture the duration between the start and end dates. In this example, it is labelled, Number of years.
- Create a hidden field to calculate the end date from the date and integer fields. In this example, it is labelled, End lease.
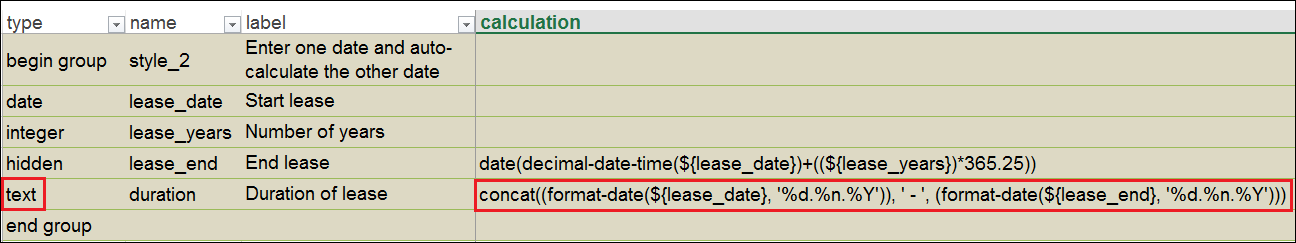
- Create a text field to capture the time range. In this example, it is labelled, Duration of lease. In the calculation column, use the concat() function.
concat((format-date(${lease_date}, '%d.%n.%Y')), ' - ', (format-date(${lease_end}, '%d.%n.%Y')))
The image below shows the formula used to represent the start and end dates of a house lease in a text field.
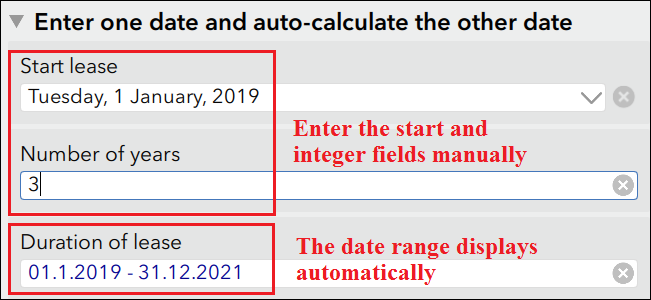
The image below shows the form created from the configured settings. Fill in both the Start lease and Number of years to display the Duration of lease.
Enter the date of an event manually and the time range of the related event is displayed automatically
This example shows the recommended time range for a newborn to receive vaccination A and vaccination B based on the date of birth.
- Open ArcGIS Survey123 Connect and create a survey using the Advanced template.
- Click the Open XLSForm spreadsheet icon
 .
. - In the type column, create a date field to capture the date of the event. In this example, it is labelled, Date of Birth.
- In the next rows, create hidden fields to calculate the start and end dates of the events related to the date field in Step 3. In this example, they are labelled, Appointment for vaccine A (start), Appointment for vaccine A (end), Appointment for vaccine B (start), and Appointment for vaccine B (end).
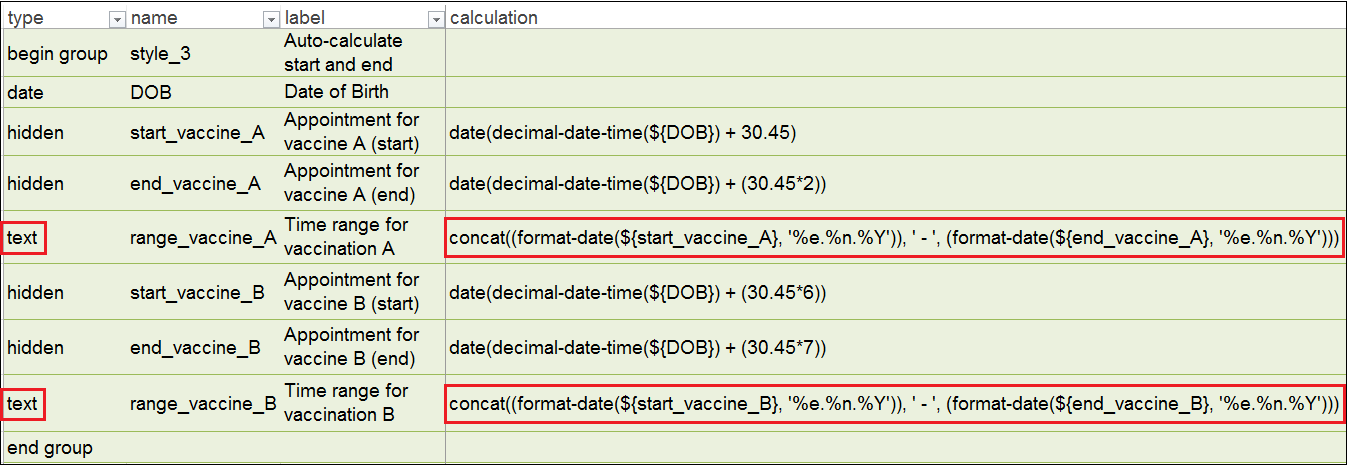
- In the next rows, create text fields to capture the time range. In this example, they are labelled, Time range for vaccination A, and Time range for vaccination B. In the calculation column, use the concat() function.
concat((format-date(${start_vaccine_A}, '%e.%n.%Y')), ' - ', (format-date(${end_vaccine_A}, '%e.%n.%Y')))

concat((format-date(${start_vaccine_B}, '%e.%n.%Y')), ' - ', (format-date(${end_vaccine_B}, '%e.%n.%Y')))
The image below shows the formula used to represent the time range for vaccination A and vaccination B based on the date of birth of the newborn.
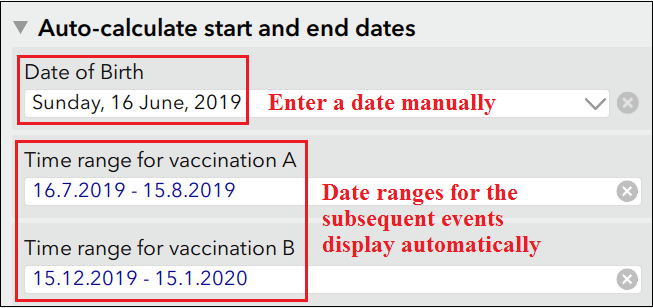
The image below shows the form created from the configured settings. Fill in the Date of Birth to display the calculated time ranges for subsequent events.
Article ID:000021116
- ArcGIS Survey123 Connect
- ArcGIS Survey123 Website
Get help from ArcGIS experts
Download the Esri Support App
Related Information
Discover more on this topic
Search for related information
Find training related to this topic
Explore ideas and give feedback