ERROR
This survey cannot be published. Only one geometry field is allowed per table, (X number) found in (survey title)
Error Message
When attempting to publish a single survey containing multiple geopoints, the following error message is returned:
Error:
This survey cannot be published. Only one geometry field is allowed per table, (X number) found in (survey title).

Cause
Survey123 for ArcGIS is limited to creating only one geometry record for each survey submitted.
Solution or Workaround
Choose one of the following workarounds to configure a survey with multiple geopoints.
Use repeats
In Survey123 Connect for ArcGIS 3.0 and later versions, multiple geopoints can be configured using repeats. Repeats create a related table that links to the main survey table to store additional geometry and add points on the map. This method is suitable for collecting employees' personal information, locating patients and respective emergency contacts, or gathering details of postgraduate students and corresponding field work locations.
In this example, two geopoints are configured in a single survey to determine the location of a patient and the location of the respective emergency contact. Submitting two surveys creates four points on the map. Use the following steps to create a survey with multiple geopoints using repeats:
- In Survey123 Connect for ArcGIS, create a survey using the Advanced template.
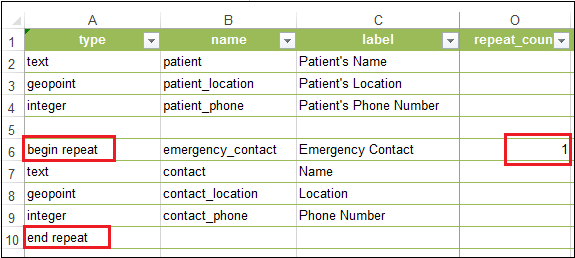
- Configure the Excel form using repeats, as shown below:
- One geopoint question located outside of a repeat.
- One geopoint question located within a repeat.
- In the repeat_count column, specify the repeat count.
In this example, Patient's Location is the geopoint outside of a repeat and the emergency contact's Location is the geopoint within a repeat. One repeat count means one additional point is plotted on the map to represent the geopoint within a repeat.
- Click Save.
- Publish the survey.
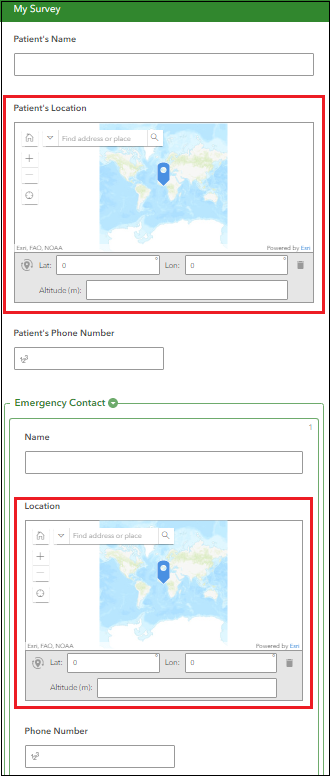
The image below shows the survey observed from the user's end. Two geopoints are successfully configured in the survey.
Once the survey entries are submitted, the points are plotted on the map and can be viewed in Map Viewer. The image below shows the data collected after two entries are submitted. The location of the two patients and the two respective emergency contacts are plotted on the map.
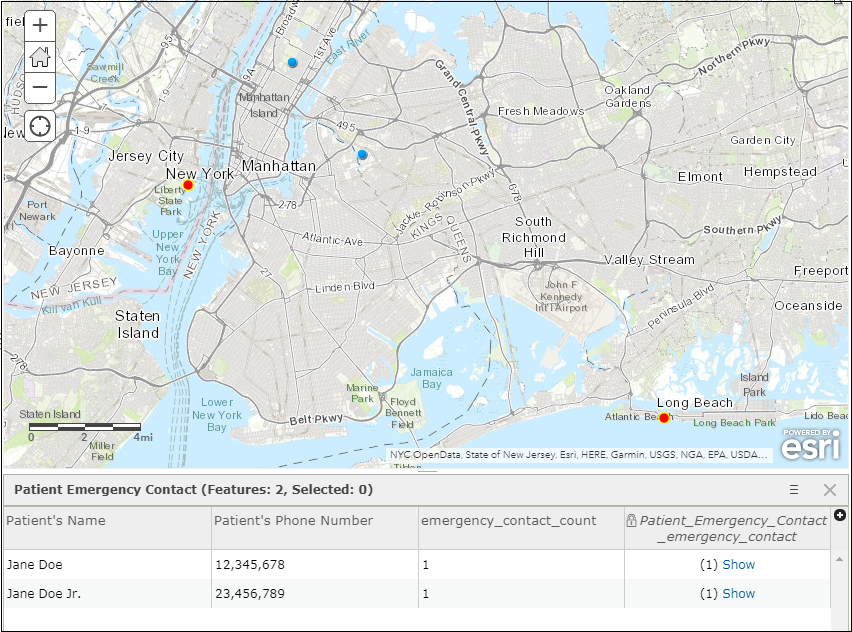
Note: Related tables can be viewed by clicking Showin the attribute table. The image below is an example of a survey with a single related record.
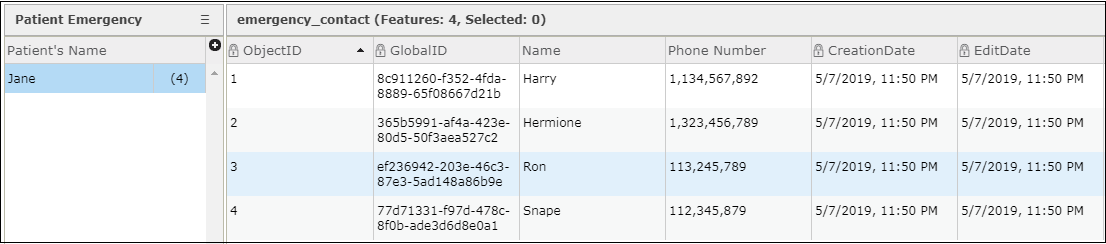
When there are multiple repeats, each point representing each repeat creates a new row in the related table. It is not possible to store multiple point records in the same row.
Use null value(s) for subsequent geopoint(s)
In Survey123 Connect for ArcGIS 2.4 and later versions, null values are supported in the bind::esri:fieldType column of the Excel form. Null values enable the configuration of multiple geopoints by storing subsequent geopoint(s) in x and y fields instead of as a geometry. This method is suitable for finding x and y data of multiple points in a survey. For example, the potential locations of treasure hunt stations, the positions of bus stops in a housing area, or the sites for an archaeological excavation.
In this example, three geopoints are configured in a single survey to determine the start, mid, and endpoint of a marathon route. Use the following steps to create a survey with multiple geopoints using null values:
- In Survey123 Connect for ArcGIS, create a survey using the Advanced template.
- Configure the Excel form using null values, as shown below:
- One geopoint question.
- One (or more) geopoint question(s), with the bind:esri:fieldType column specified as null.
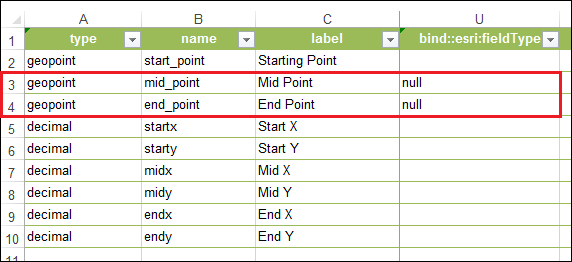
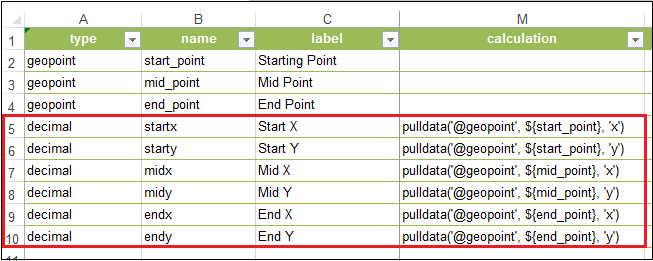
- Multiple decimal questions, depending on the number of x and y fields that need to be extracted from the geopoints. The calculation column is configured with the pulldata() function.
- Click Save.
- Publish the survey.
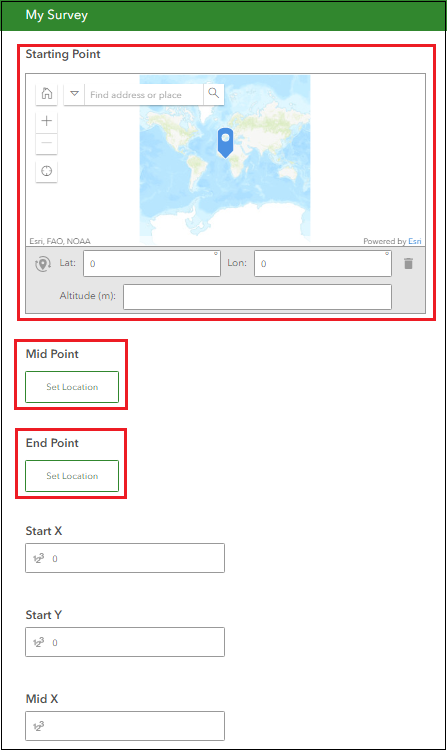
The image below shows the survey observed from the user's end. Three geopoints are successfully configured in the survey.
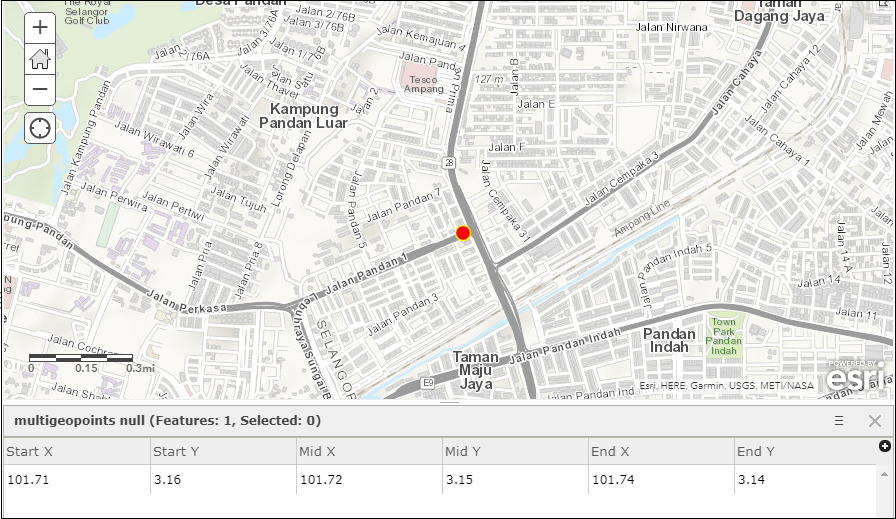
The image below shows the data collected after an entry with three geopoints are submitted. Only one geopoint without the null value set in the bind::esri::fieldType column is plotted on the map. Geopoints with null values configured are not plotted on the map. The x and y data of the three geopoints are listed in the attribute table.
Article ID: 000019996
- ArcGIS Online
- ArcGIS Survey123 Field App iOS
Get support with AI
Resolve your issue quickly with the Esri Support AI Chatbot.


Related Information
Discover more on this topic
Search for related information
Find training related to this topic
Explore ideas and give feedback
Get help from ArcGIS experts
Start chatting now