HOW TO
Create a web map from a JSON file using ArcGIS API for Python version 2.3 and prior
Summary
In some cases, it is favorable to create a web map using a script, as it can be programmed for multiple web maps. Using the definition specified in a JSON file, the gis.content.add function in ArcGIS API for Python version 2.3 and prior can be used to create the web map.
Procedure
Web maps can be created from a JSON file representation using the gis.content.add function in the GIS module. There are two ways to do :
- Reading the JSON file within the script.
- Defining the JSON description in the script.
Note:
Defining the JSON description is a longer process. However, it gives the user the ability to modify the JSON representation of the script.
The steps below describe how to create a web map from a JSON file by reading it using the json module.
-
Import the necessary modules.
from arcgis.gis import GIS
from arcgis.mapping import WebMap
import json
- Specify the login credentials.
gis = GIS('https://<machine>.<domain>/<web adaptor name>/home', 'username', 'password', verify_cert=False)
print ('Connected')
- Open the JSON file.
with open('/home/jupyter/test2.json') as json_data:
	data = json.load(json_data)
- Create the new map.
item_properties_dict = {"type": "Web Map","title": "Test Map","tags": ["test","test1","test2"],"snippet":"This is a snippet", "text":data}

newmap = gis.content.add(item_properties = item_properties_dict)
newmap
The following shows the full script:
from arcgis.gis import GIS
from arcgis.mapping import WebMap
import json

gis = GIS('https://<machine>.<domain>/<web adaptor name>/home', 'username', 'password', verify_cert=False)
print ('Connected')

with open('/home/jupyter/test2.json') as json_data:
	data = json.load(json_data)

item_properties_dict = {"type": "Web Map","title": "Test Map","tags": ["test","test1","test2"],"snippet":"This is a snippet", "text":data}

newmap = gis.content.add(item_properties = item_properties_dict)
newmap
The steps below describe how to create a web map by defining the JSON description in the script.
- Follow steps 1 and 2 from the method above.
- Define the dictionary containing the JSON used to create the web map.
data = {
	"operationalLayers": [{
			"id": "layer_2382",
			"layerType": "ArcGISMapServiceLayer",
			"url": "https://sampleserver6.arcgisonline.com/arcgis/rest/services/Census/MapServer",
			"visibility": True,
			"opacity": 1,
			"title": "Census Data",
			"layers": [{
					"id": 0,
					"layerDefinition": {
						"source": {
							"type": "mapLayer",
							"mapLayerId": 0
						}
					},
					"name": "Census Block Points",
					"minScale": 99999.99998945338,
					"maxScale": 0,
					"parentLayerId": -1,
					"defaultVisibility": True
				}, {
					"id": 1,
					"layerDefinition": {
						"source": {
							"type": "mapLayer",
							"mapLayerId": 1
						},
						"drawingInfo": {
							"renderer": {
								"type": "simple",
								"label": "",
								"description": "",
								"symbol": {
									"color": [0, 0, 0, 0],
									"outline": {
										"color": [230, 230, 0, 255],
										"width": 0.39975000000000005,
										"type": "esriSLS",
										"style": "esriSLSSolid"
									},
									"type": "esriSFS",
									"style": "esriSFSSolid"
								}
							}
						}
					},
					"name": "Census Block Group",
					"minScale": 1000000,
					"maxScale": 0,
					"parentLayerId": -1,
					"defaultVisibility": True
				}, {
					"id": 2,
					"layerDefinition": {
						"source": {
							"type": "mapLayer",
							"mapLayerId": 2
						},
						"drawingInfo": {
							"renderer": {
								"type": "simple",
								"label": "",
								"description": "",
								"symbol": {
									"color": [0, 0, 0, 0],
									"outline": {
										"color": [230, 230, 0, 255],
										"width": 0.5625,
										"type": "esriSLS",
										"style": "esriSLSSolid"
									},
									"type": "esriSFS",
									"style": "esriSFSSolid"
								}
							}
						}
					},
					"name": "Detailed Counties",
					"minScale": 0,
					"maxScale": 0,
					"parentLayerId": -1,
					"defaultVisibility": True
				}, {
					"id": 3,
					"layerDefinition": {
						"source": {
							"type": "mapLayer",
							"mapLayerId": 3
						},
						"drawingInfo": {
							"renderer": {
								"type": "simple",
								"label": "",
								"description": "",
								"symbol": {
									"color": [0, 0, 0, 0],
									"outline": {
										"color": [230, 230, 0, 255],
										"width": 2,
										"type": "esriSLS",
										"style": "esriSLSSolid"
									},
									"type": "esriSFS",
									"style": "esriSFSSolid"
								}
							}
						}
					},
					"name": "states",
					"minScale": 0,
					"maxScale": 0,
					"parentLayerId": -1,
					"defaultVisibility": True
				}
			]
		}
	],
	"baseMap": {
		"baseMapLayers": [{
				"id": "labels",
				"layerType": "ArcGISTiledMapServiceLayer",
				"url": "https://services.arcgisonline.com/arcgis/rest/services/Canvas/World_Dark_Gray_Base/MapServer",
				"visibility": True,
				"opacity": 1,
				"title": "World_Dark_Gray_Base"
			}, {
				"id": "base",
				"layerType": "ArcGISTiledMapServiceLayer",
				"url": "https://services.arcgisonline.com/arcgis/rest/services/Canvas/World_Dark_Gray_Reference/MapServer",
				"visibility": True,
				"opacity": 1,
				"title": "World_Dark_Gray_Reference"
			}
		],
		"title": "Basemap"
	},
	"spatialReference": {
		"wkid": 102100,
		"latestWkid": 3857
	},
	"authoringApp": "WebMapViewer",
	"authoringAppVersion": "10.6.1",
	"version": "2.11"
}
- Create the new map.
item_properties_dict = {"type": "Web Map","title": "Test Map","tags": ["test","test1","test2"],"snippet":"This is a snippet", "text":data}

newmap = gis.content.add(item_properties = item_properties_dict)
newmap
The following shows the full script:
from arcgis.gis import GIS
from arcgis.mapping import WebMap

gis = GIS('https://<machine>.<domain>/<web adaptor name>/home', 'username', 'password', verify_cert=False)
print ('Connected')

data = {
	"operationalLayers": [{
			"id": "layer_2382",
			"layerType": "ArcGISMapServiceLayer",
			"url": "https://sampleserver6.arcgisonline.com/arcgis/rest/services/Census/MapServer",
			"visibility": True,
			"opacity": 1,
			"title": "Census Data",
			"layers": [{
					"id": 0,
					"layerDefinition": {
						"source": {
							"type": "mapLayer",
							"mapLayerId": 0
						}
					},
					"name": "Census Block Points",
					"minScale": 99999.99998945338,
					"maxScale": 0,
					"parentLayerId": -1,
					"defaultVisibility": True
				}, {
					"id": 1,
					"layerDefinition": {
						"source": {
							"type": "mapLayer",
							"mapLayerId": 1
						},
						"drawingInfo": {
							"renderer": {
								"type": "simple",
								"label": "",
								"description": "",
								"symbol": {
									"color": [0, 0, 0, 0],
									"outline": {
										"color": [230, 230, 0, 255],
										"width": 0.39975000000000005,
										"type": "esriSLS",
										"style": "esriSLSSolid"
									},
									"type": "esriSFS",
									"style": "esriSFSSolid"
								}
							}
						}
					},
					"name": "Census Block Group",
					"minScale": 1000000,
					"maxScale": 0,
					"parentLayerId": -1,
					"defaultVisibility": True
				}, {
					"id": 2,
					"layerDefinition": {
						"source": {
							"type": "mapLayer",
							"mapLayerId": 2
						},
						"drawingInfo": {
							"renderer": {
								"type": "simple",
								"label": "",
								"description": "",
								"symbol": {
									"color": [0, 0, 0, 0],
									"outline": {
										"color": [230, 230, 0, 255],
										"width": 0.5625,
										"type": "esriSLS",
										"style": "esriSLSSolid"
									},
									"type": "esriSFS",
									"style": "esriSFSSolid"
								}
							}
						}
					},
					"name": "Detailed Counties",
					"minScale": 0,
					"maxScale": 0,
					"parentLayerId": -1,
					"defaultVisibility": True
				}, {
					"id": 3,
					"layerDefinition": {
						"source": {
							"type": "mapLayer",
							"mapLayerId": 3
						},
						"drawingInfo": {
							"renderer": {
								"type": "simple",
								"label": "",
								"description": "",
								"symbol": {
									"color": [0, 0, 0, 0],
									"outline": {
										"color": [230, 230, 0, 255],
										"width": 2,
										"type": "esriSLS",
										"style": "esriSLSSolid"
									},
									"type": "esriSFS",
									"style": "esriSFSSolid"
								}
							}
						}
					},
					"name": "states",
					"minScale": 0,
					"maxScale": 0,
					"parentLayerId": -1,
					"defaultVisibility": True
				}
			]
		}
	],
	"baseMap": {
		"baseMapLayers": [{
				"id": "labels",
				"layerType": "ArcGISTiledMapServiceLayer",
				"url": "https://services.arcgisonline.com/arcgis/rest/services/Canvas/World_Dark_Gray_Base/MapServer",
				"visibility": True,
				"opacity": 1,
				"title": "World_Dark_Gray_Base"
			}, {
				"id": "base",
				"layerType": "ArcGISTiledMapServiceLayer",
				"url": "https://services.arcgisonline.com/arcgis/rest/services/Canvas/World_Dark_Gray_Reference/MapServer",
				"visibility": True,
				"opacity": 1,
				"title": "World_Dark_Gray_Reference"
			}
		],
		"title": "Basemap"
	},
	"spatialReference": {
		"wkid": 102100,
		"latestWkid": 3857
	},
	"authoringApp": "WebMapViewer",
	"authoringAppVersion": "10.6.1",
	"version": "2.11"
}

item_properties_dict = {"type": "Web Map","title": "Test Map","tags": ["test","test1","test2"],"snippet":"This is a snippet", "text":data}

newmap = gis.content.add(item_properties = item_properties_dict)
newmap
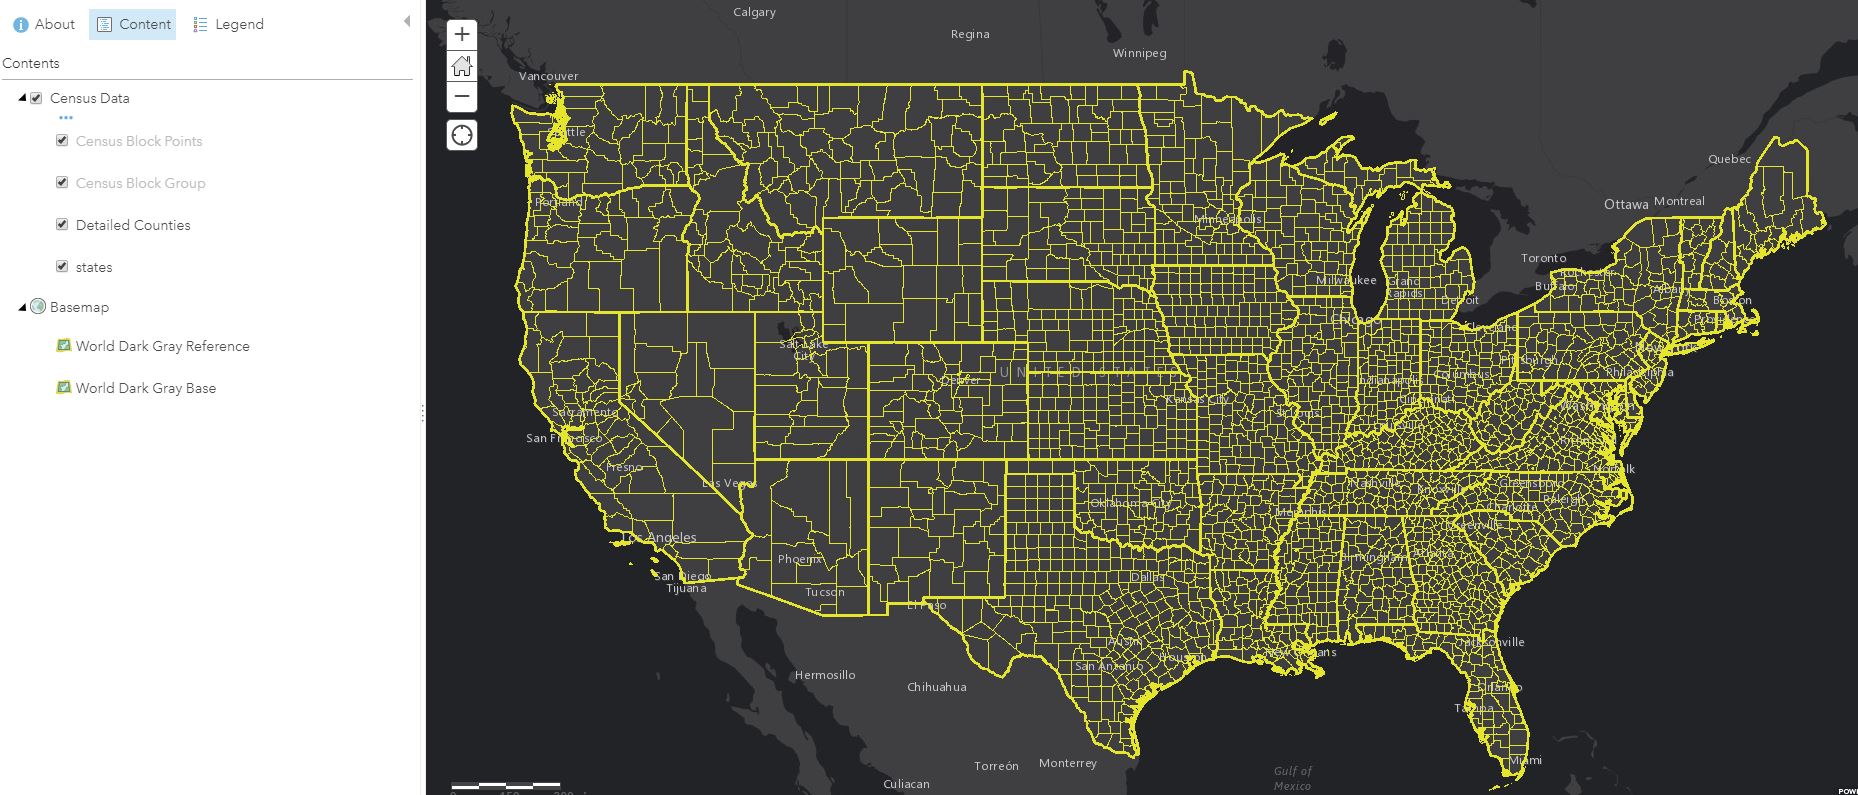
The image below shows the newly created web map.
Article ID: 000019701
- Portal for ArcGIS
- ArcGIS Server
- ArcGIS API for Python
Get support with AI
Resolve your issue quickly with the Esri Support AI Chatbot.


Related Information
Discover more on this topic
Search for related information
Find training related to this topic
Explore ideas and give feedback
Get help from ArcGIS experts
Start chatting now