Frequently asked question
Why the Kriging tool output raster does not show the same maximum and minimum class break values as the input point feature values?
Answer
The output raster of the Kriging tool does not show the same maximum and minimum class break values as the input point feature values because:
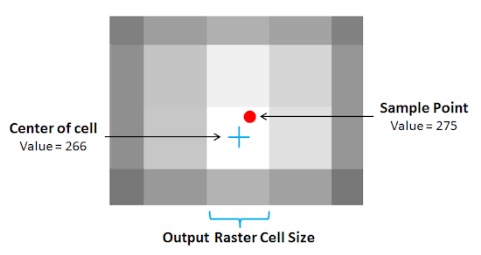
- Raster cells are unlikely to be centered at maximum and minimum sample points. For example, the image below shows the maximum input data is 275, while the center of the output raster cell containing the sample point is 266.
- The values and weights of surrounding points affect a point with an extreme value. The smoothing algorithm causes the cell containing an input point value of 30 (relatively high value) to have a reduced output center cell value within the range of 20 - 25 when surrounded by input point values within the range of 15 - 20 (relatively low value).
- In some cases, the predicted output value does not include all the data points provided (outside of the search radius), while in other cases, the data points are not enough to create the most probable output value.
- The class break values yielded by the Kriging tool are dependent on the fields specified in the tool. Specifying Advanced Parameters and optional fields (Output cell size and Search radius) create more accurate results. However, the predicted output value may differ from the input data because each setting runs on different sets of formulas and assumptions. For more information, refer to ArcMap help: How Kriging works.
- Choosing different interpolation methods and specifying parameters may return different output values. If the Kriging tool does not create the desired or expected output based on the input data, use other interpolation methods. To compare interpolation methods in the Spatial Analyst toolbox, refer to ArcMap help: Comparing interpolation methods.
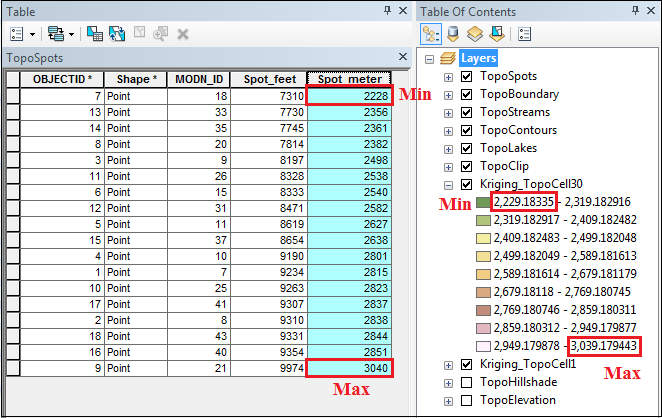
Note:
Different Kriging models and other geostatistical interpolation methods are available in the Geostatistical Analyst toolbox. The Geostatistical Analyst toolbox complements the Spatial Analyst toolbox. It provides additional interpolation methods and more parameter options for a variety of output surfaces. For more information, refer to ArcMap help: What is the ArcGIS Geostatistical Analyst extension? and ArcGIS Geostatistical Analyst: Common Questions.
The image below shows the maximum and minimum z-values (Spot_meter) of the input point features in the attribute table are 3040 and 2228 respectively. Using the Kriging (Spatial Analyst) tool's default settings and an Output cell size of 30.54125, the maximum and minimum values of the Kriging class breaks are 3039.179443 and 2229.18335 respectively.
Provided below are useful tips on minimizing the difference between the output class break values and input point feature values:
Reduce the output cell size
- In ArcMap, open the Kriging tool.
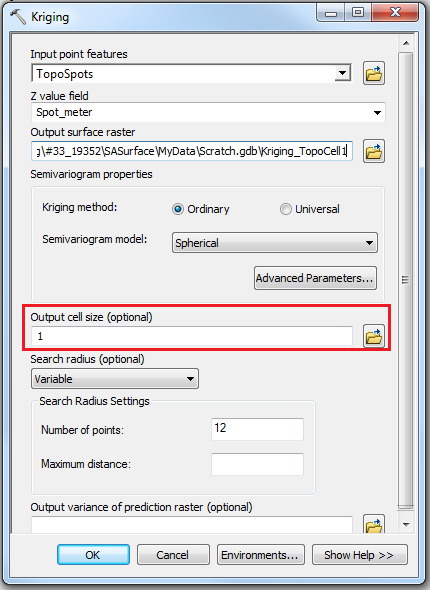
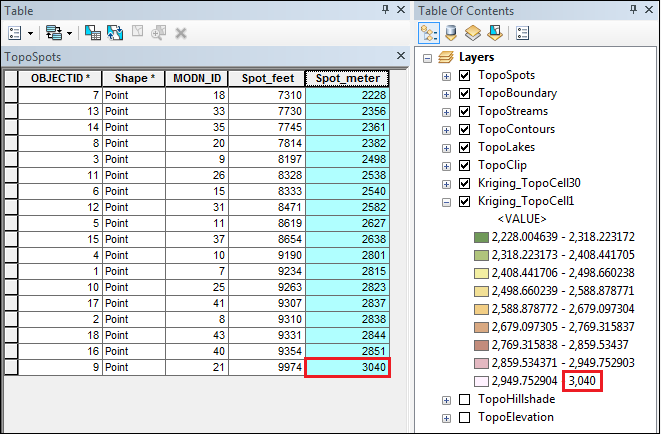
- In the Output cell size (optional) field, specify a small cell size. The image below shows the Output cell size is specified as 1.
- Run the tool.
Note:
The smaller the specified cell size, the longer the Kriging tool processing time.
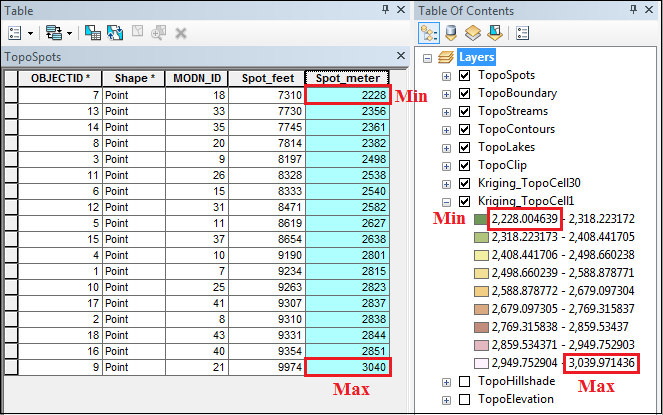
The image below shows the maximum and minimum values of the Kriging class breaks are 3039.971436 and 2228.004639 respectively. The difference between the output class break values and the input point feature values is smaller when the cell size is one, compared to when the cell size is 30. For more information on cell size, refer to ArcGIS Blog: Choosing an appropriate cell size when interpolating raster data.
Change the maximum output value manually
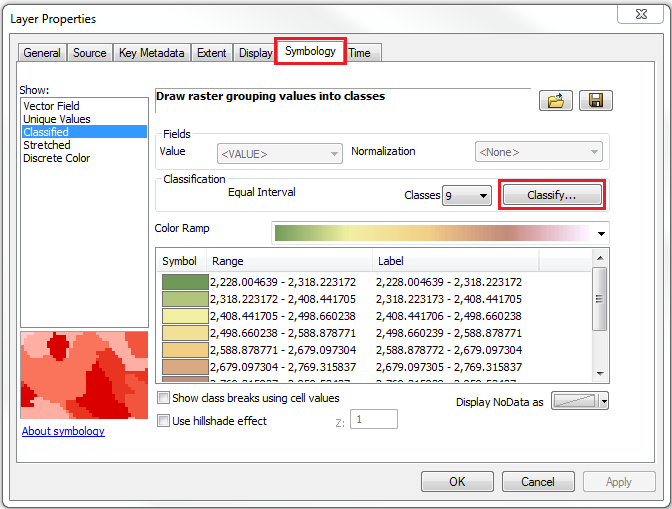
- In ArcMap, right-click the Kriging layer generated in the Table Of Contents, and select Properties > Symbology.
- In the Layer Properties dialog box, select the Symbology tab. Click Classify.
- In the Classification dialog box, navigate to Break Values and change the break value manually to match the maximum value of the input data.
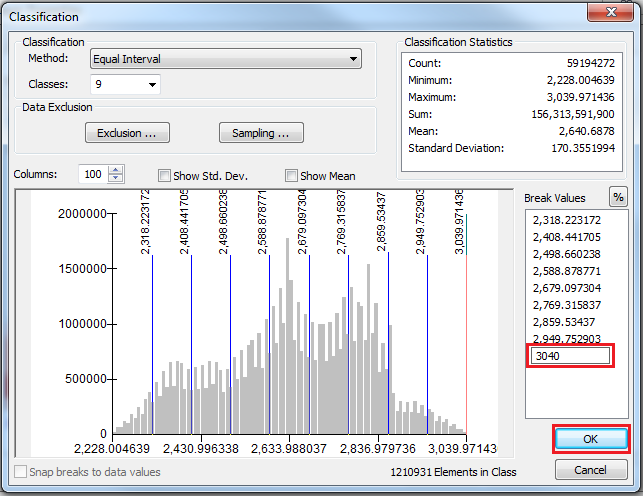
- Click OK to close both windows.
The maximum break value matches the maximum input value of 3040.
The exact interpolation technique predicts a value identical to the measured value at a sampled location. An example of an exact interpolation method is IDW. With default settings and an Output cell size of 30.54125, the maximum and minimum class break values are 3039.973877 and 2228.154297 respectively. The table and the image below show the comparison between the output values and input values. The IDW tool yields maximum and minimum class break values that deviate less compared to the Kriging tool with the same default settings. For more information, refer to ArcMap help: How IDW works.
| Input values | Output values | ||
| IDW | Kriging | ||
| Maximum | 3040 | 3039.973877 | 3039.179443 |
| Minimum | 2228 | 2228.154297 | 2229.183350 |
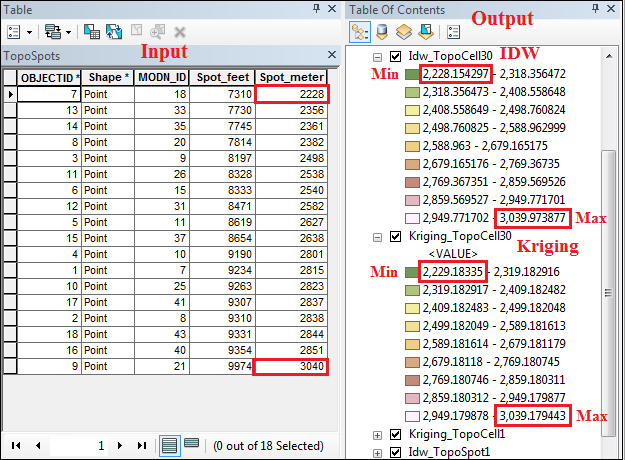
Although an exact interpolator passes through all sample points, deviation from the input data occurs because the output raster cells are not centered exactly at maximum and minimum sample points. So, the output rasters are higher than the minimum value and lower than the maximum value.
Note:
The IDW tool works best for dense and evenly spaced sampled points.
Article ID:000019352
Software:
- ArcMap
Get help from ArcGIS experts
Download the Esri Support App
Related Information
Discover more on this topic
Search for related information
Find training related to this topic
Explore ideas and give feedback