HOW TO
Create contour polygons from a DEM using the Filled Contours tool
Summary
Contour polygons are created to find the area of elevation values between two elevation contours, or to assist in visualizing a map containing contour data. Representing a mapped area in color-coded polygons makes visualization and analysis more apparent.
The article How To: Create polygons from contour polylines describes the tools used in ArcMap to create polygons from contour data. As an alternative, the Filled Contours tool in the Spatial Analyst Supplemental Tools toolbox add-in enables the creation of contour polygons directly from Digital Elevation Model (DEM) data. The Spatial Analyst Supplemental Tools toolbox can be downloaded and installed at ArcGIS Desktop 10.2 and later versions.
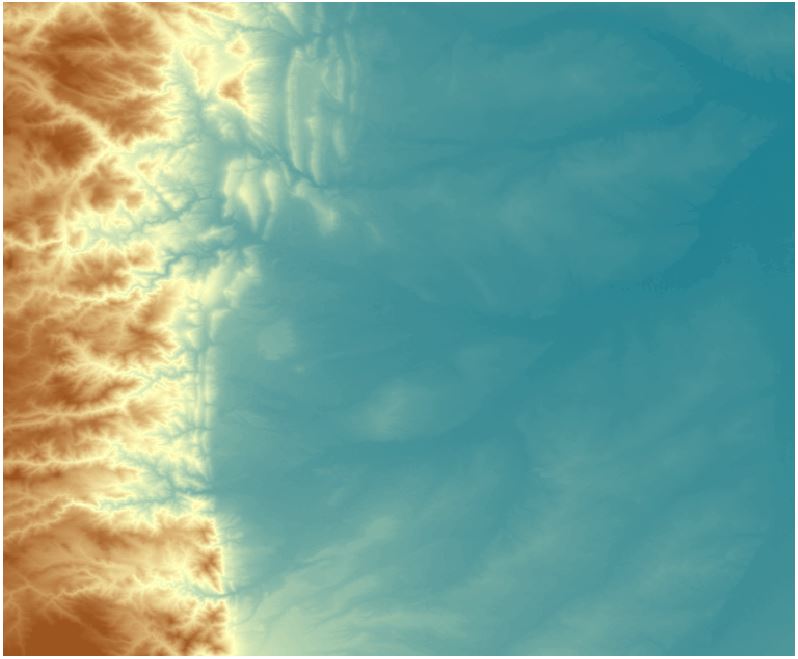
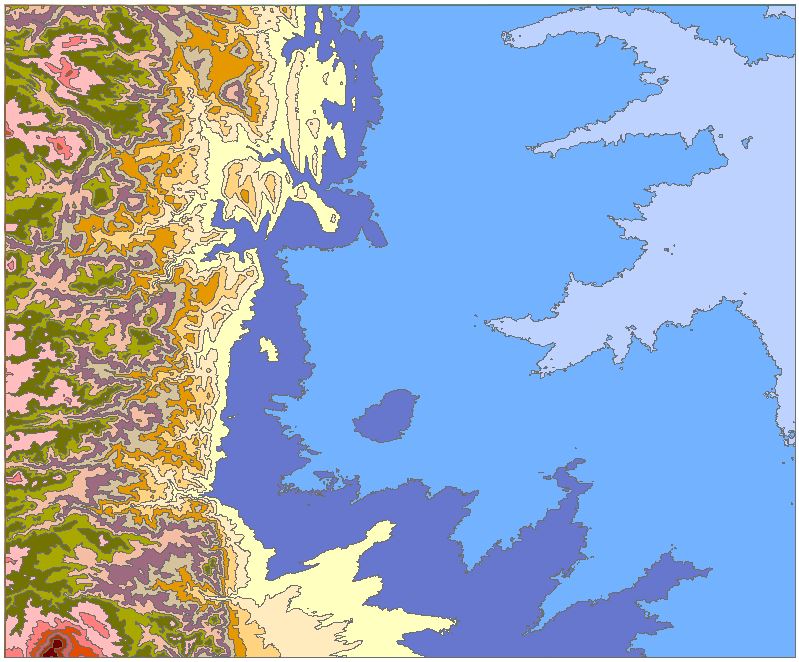
The image below represents a DEM image of high elevation mountain ranges to the west (left) and low-lying areas to the east (right). In this article, contour polygons are created to visualize the whole area in 100-meter contour intervals.
Procedure
Note:
The Filled Contours tool from the toolbox used in this workflow requires the use of an ArcGIS Desktop Advanced license.
The following instructions describe how to create contour polygons from a DEM using the Filled Contours tool in the Spatial Analyst Supplemental Tools toolbox.
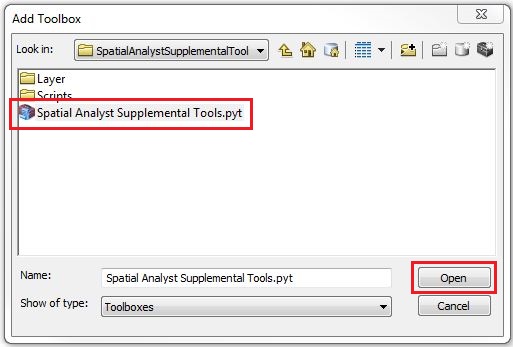
- Download the Spatial Analyst Supplemental Tools toolbox from the ArcGIS website.
- To install the downloaded toolbox, click the Geoprocessing menu > select ArcToolbox > right-click anywhere in the ArcToolbox pane > select Add Toolbox.
- Browse for the downloaded file in Step 1, and select Spatial Analyst Supplemental Tools.pyt. Click Open.
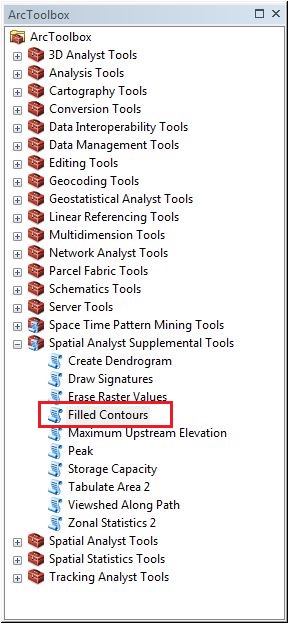
- To create contour polygons, navigate to the Geoprocessing menu > select ArcToolbox > open the Spatial Analyst Supplemental Tools > click the Filled Contours tool. This opens the Filled Contours dialog box.
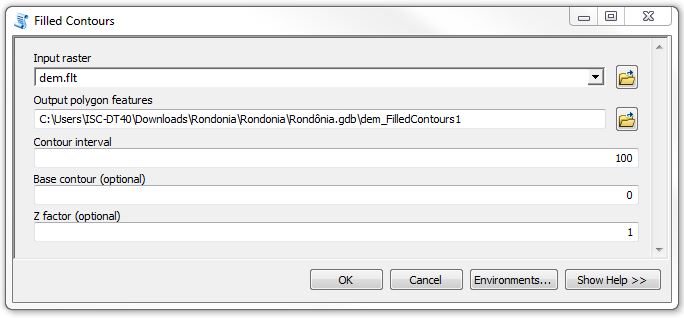
- For Input Raster, browse for the file containing the DEM.
- Specify the Contour Interval as the value of interest in defining the geographic boundary.
- Click OK.
- Change the symbology as desired by double-clicking the respective symbol in the Table of Contents. In the Symbol Selector dialog box, change fill color and other features.
The output image below shows the contour polygons generated with a classification based on 100-meter contour intervals.
Article ID: 000017732
- ArcMap
Get support with AI
Resolve your issue quickly with the Esri Support AI Chatbot.


Related Information
Discover more on this topic
Search for related information
Find training related to this topic
Explore ideas and give feedback
Get help from ArcGIS experts
Start chatting now