Frequently asked question
Why do enriched data values differ between sites with identical drive time distances in Business Analyst Web App?
Answer
The ArcGIS Business Analyst Web App uses the GeoEnrichment service to obtain enriched data related to people, places, and businesses in a specific area or within a certain distance or drive time from a location. In some instances, enriched data values differ between sites with identical drive time distances in the web app.
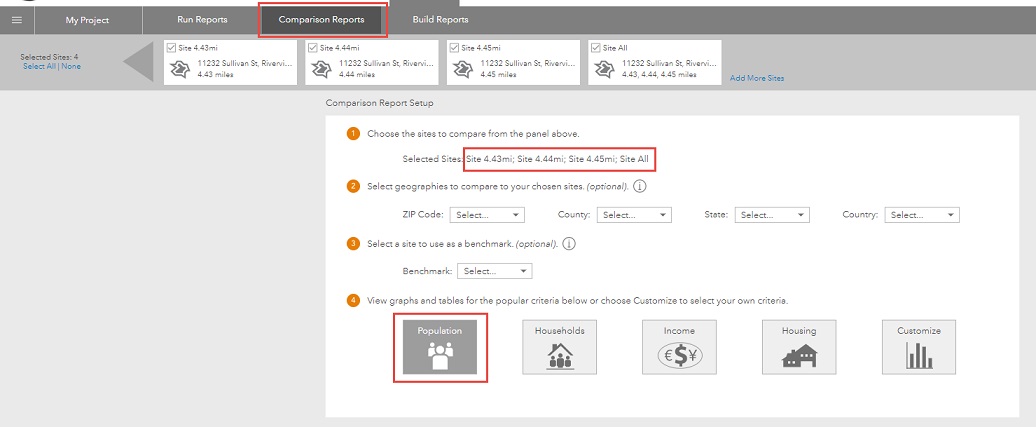
For example, consider running a Comparison Report on a single site with three drive times (4.43, 4.44, 4.45mi) - "Site All":
The Comparison report shows that the population count within the smallest drive time area, 4.43 miles, matches that of the single drive time site for 4.43 miles. However, the subsequent larger areas within the single combined sites differ from the corresponding individual drive time sites. These values are slightly larger than the values from the individual drive time sites.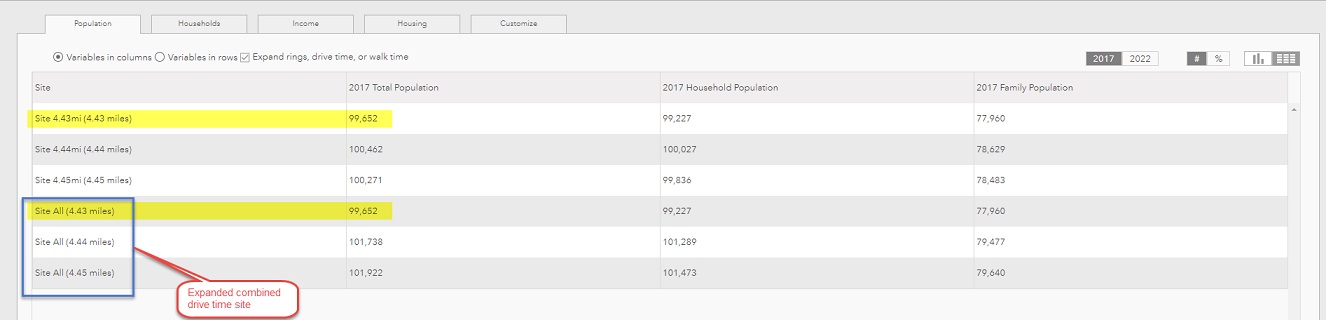
The difference is because Business Analyst Web App employs hierarchical service areas. The algorithm for generating hierarchical areas trades off accuracy for speed, and generalizes the shapes of the areas to improve performance. The algorithm traverses a slightly larger area from the last break to get a more presentable polygon. Therefore, the differences in the size of the area and the enriched values representing the last break values (4.44 and 4.45 miles) is expected.
To produce the most accurate enrichment values, run the different drive time area sites individually with one drive time each: 'Site 4.43mi', 'Site 4.44mi", and 'Site 4.45mi'.
Article ID:000016536
- ArcGIS Business Analyst Web App
Get help from ArcGIS experts
Download the Esri Support App
Related Information
Discover more on this topic
Search for related information
Find training related to this topic
Explore ideas and give feedback