HOW TO
Calculate and visualize 3D density for z-enabled points
Summary
When visualizing the quantity of an input point layer, points in close proximity can be difficult to analyze and differentiate. In this case, 3D density values can be used to display the relative density of points using a color scheme. To perform the 3D density analysis, the layer surface is treated as an elevation surface, and density values for the z-enabled points are calculated.
Procedure
The following steps describe how to calculate and visualize 3D density for z-enabled points:
Note:
The Buffer 3D tool and the Inside 3D tool require an ArcGIS 3D Analyst license.
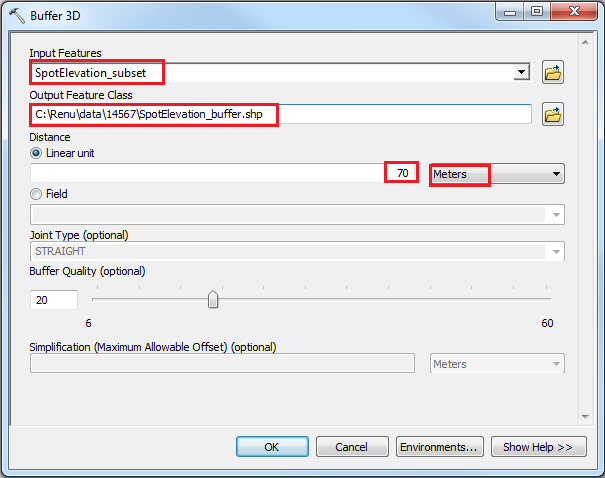
- Run the Buffer 3D tool to create three-dimensional buffers around the points:
- For Input Features, select the point layer.
- Set the output name and location.
- Specify the desired distance, and select Meters for unit.
- Click OK.
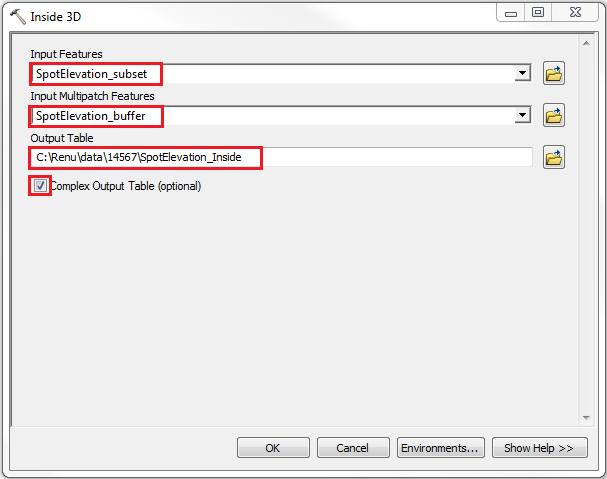
- Run the Inside 3D tool to create a complex output table:
- For Input Features, select the point layer.
- For Input Multipatch Features, select the buffer output generated in Step 1.
- Specify the output table name and location.
- Check the Complex Output Table > click OK. This step generates a unique ID known as CONTAIN_ID for each multipatch intersecting the input features.
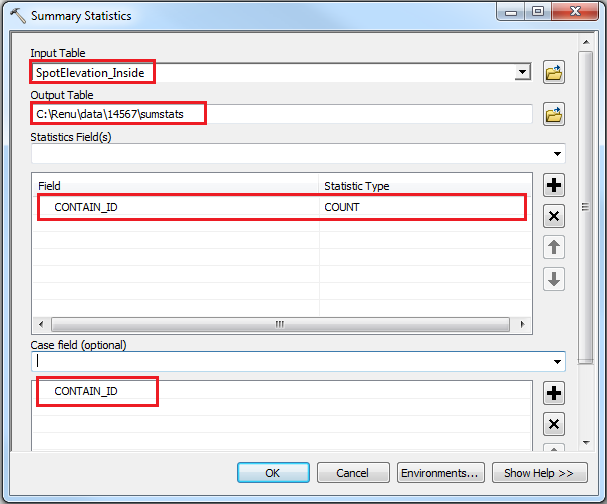
- Run the Summary Statistics tool on the output table, and set the parameters as below. This step generates density values (number of points) in each 3D buffer.
- For Input Table, select the complex output table generated in Step 2.
- Specify the summary statistics output table name and location.
- Select CONTAIN_ID from the Statistic Field drop-down list, and set COUNT for Statistic Type.
- Select CONTAIN_ID from the Case field drop-down list, and click OK.
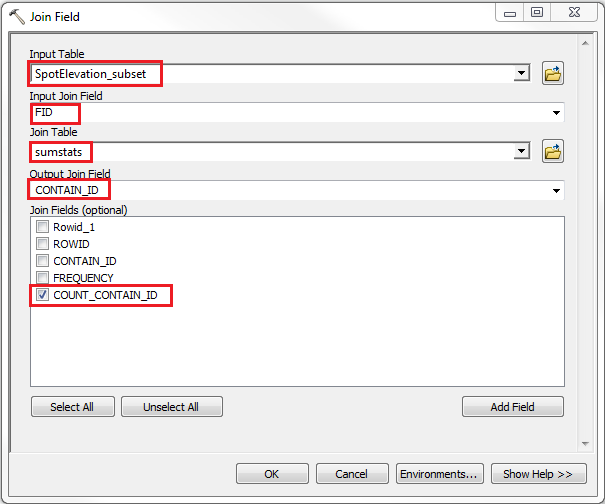
- Run the Join Field tool to join the density values from the summary statistics table to the point layer's attribute table.
- For Input Table, select the point layer.
- Select FID or OBJECTID for Input Join Field.
- For Join Table, select the summary statistics output table generated in Step 3.
- Select CONTAIN_ID for Output Join Field.
- Check the COUNT_CONTAIN_ID > click OK.
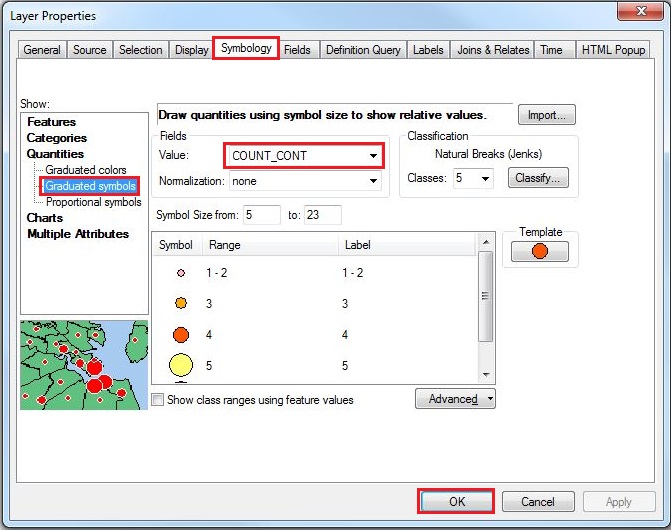
- Right-click the point layer in the Table Of Contents > Properties.
- In the Layer Properties window, apply symbology as desired > click OK.
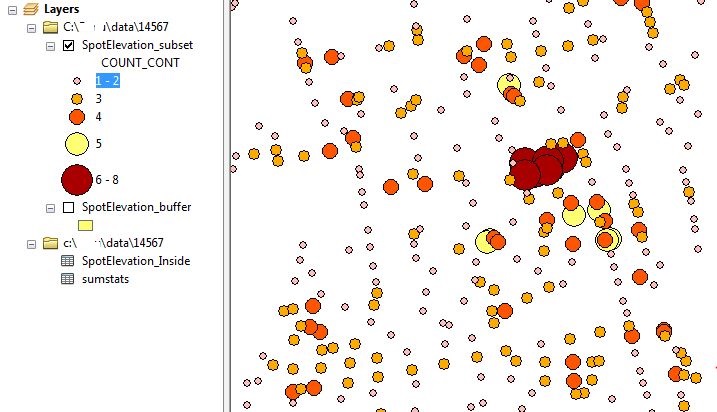
The image below shows the output 3D density layer after applying symbology.
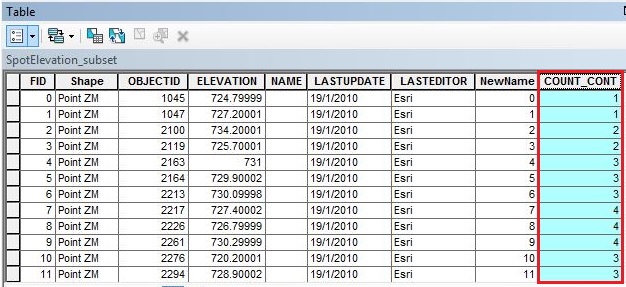
The density values are added to the point layer's attribute table as shown below.
Article ID:000014567
- ArcMap
Get help from ArcGIS experts
Download the Esri Support App
Related Information
Discover more on this topic
Search for related information
Find training related to this topic
Explore ideas and give feedback