HOW TO
Create a time animation from a shapefile
Summary
To create a time animation, Date/Time data is required. The Date type fields in a shapefile support either the date or the time, but not both in the same field.
Sometimes, a problem arises when exporting a geodatabase feature class containing a Date/Time field to a shapefile. After exporting, the time value in the shapefile is truncated. Only the date value is maintained.
Shapefiles containing date and time data in a String type field can still be used to create a time animation to visualize temporal data over time.
This article describes how to create a time animation using a shapefile.
Procedure
- In the shapefile attribute table, use a Text type field and reformat the date and time values by removing any unnecessary text. Use the appropriate date and time format. For example, YYYY-MM-DD hh:mm:ss would be written as 2017-06-11 01:23:45.
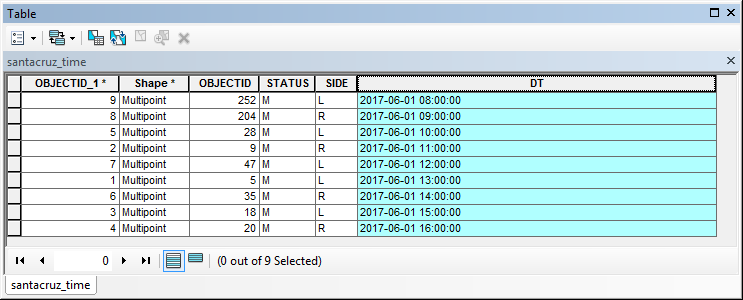
Note:
The Field Calculator can be used to remove unnecessary text in the field attributes. For more information, refer to the following ArcGIS Web Help topic, Making simple field calculations. Additionally, the time values must be in a supported format. Refer to the following ArcGIS Web Help topic: Supported field formats. For more information on formatting date fields, refer to the following ArcGIS Web Help topic, Fundamentals of date fields.
- Enable time on the new layer and edit the layer properties.
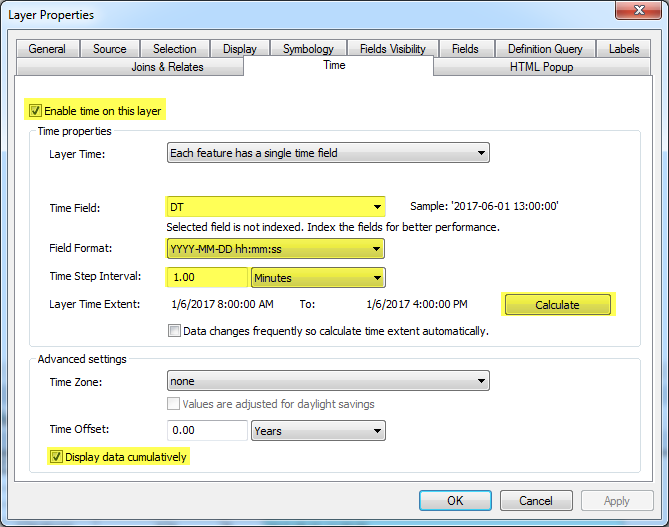
- Open the properties of the new layer and click the Time tab.
- Check the Enable time on this layer check box.
- Select the field containing the date and time data in the Time Field drop-down list.
- Select the respective field format in the Field Format drop-down list.
- Click the Calculate button to calculate the layer time extent.
- Set the Time Step Interval.
- Check the Display data cumulatively check box.
- Click OK.
- Open the Time Slider window
![[O-Image]](https://webapps-cdn.esri.com/CDN/support-site/technical-articles-images/000012836/00N39000003LL2C-0EM39000000wdm9.png) and click Options. This opens the Time Slider Options window.
and click Options. This opens the Time Slider Options window.
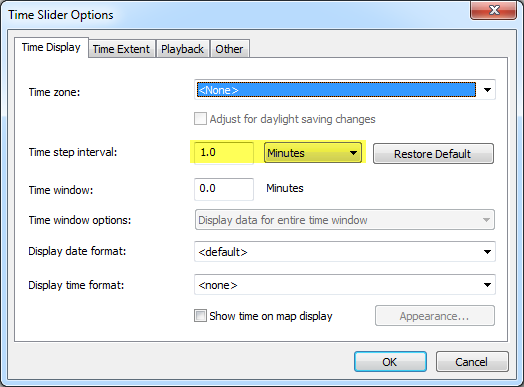
- In the Time Display tab, set the respective Time step interval.
- In the Time Extent tab, select <All time enabled data> in the Restrict full time extent to: drop-down list.
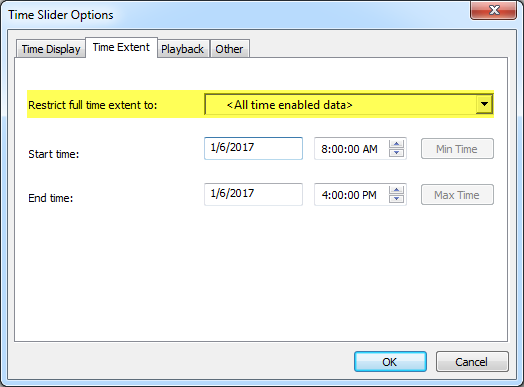
- Click OK.
- In the Time Display tab, set the respective Time step interval.
- Click the Enable time on map option
 in the Time Slider window and play the animation. The temporal data is displayed over time in the map.
Article ID: 000012836
- ArcMap
Get support with AI
Resolve your issue quickly with the Esri Support AI Chatbot.


Related Information
Discover more on this topic
Search for related information
Find training related to this topic
Explore ideas and give feedback
Get help from ArcGIS experts
Start chatting now