HOW TO
Apply scale-based symbology to view different feature geometries at different map scales in ArcGIS Online
Summary
In certain cases, it is best to have different feature geometries represented at different map scales for better data visibility. For example, presenting districts or counties as polygons on a large scale when zooming in and as points on a small scale when zooming out.
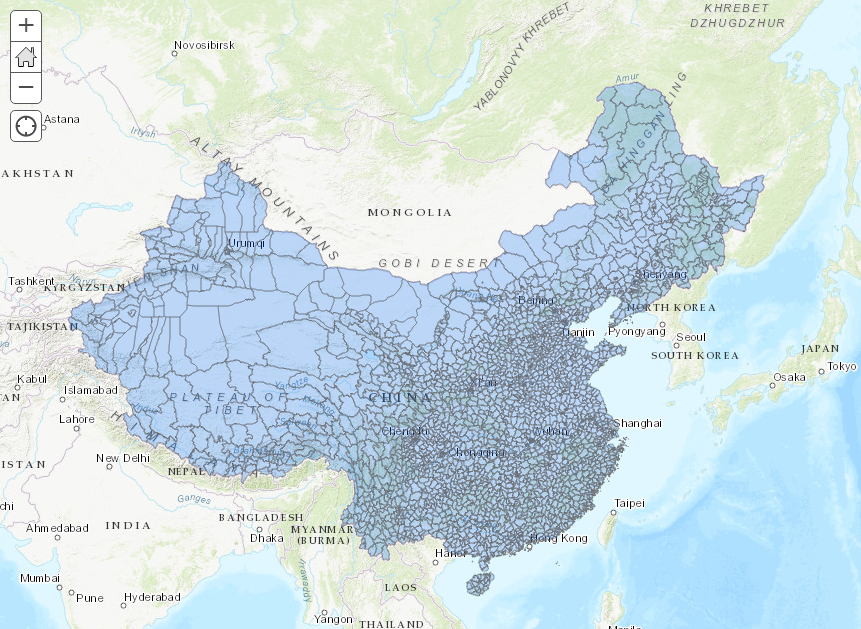
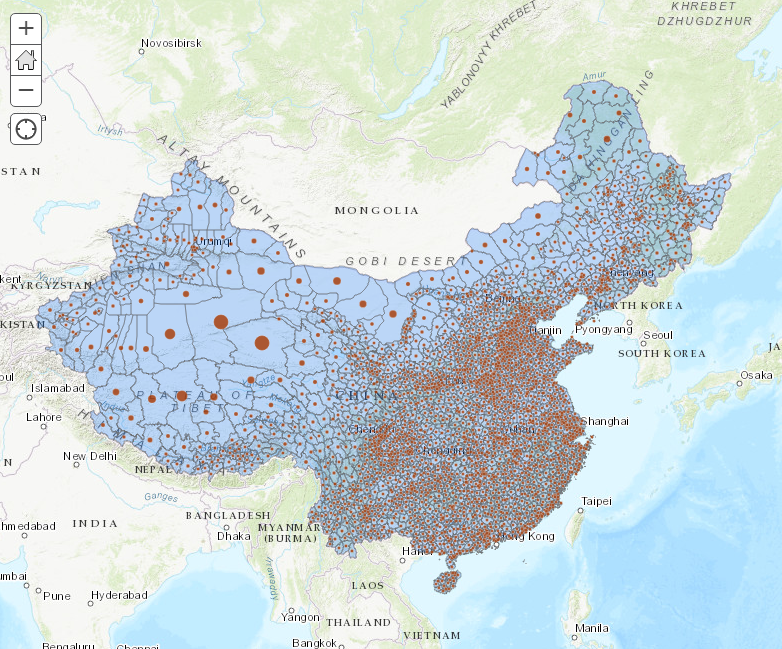
The image below shows the polygon layer of counties in China on a small scale. Small polygons representing small-sized counties in southeastern China appear cluttered on the map.
Procedure
The following instructions describe how to apply scale-based symbology to view different feature geometries at different map scales in ArcGIS Online. In this article, the workflow shows changing polygon features to point features when zooming out of the map.
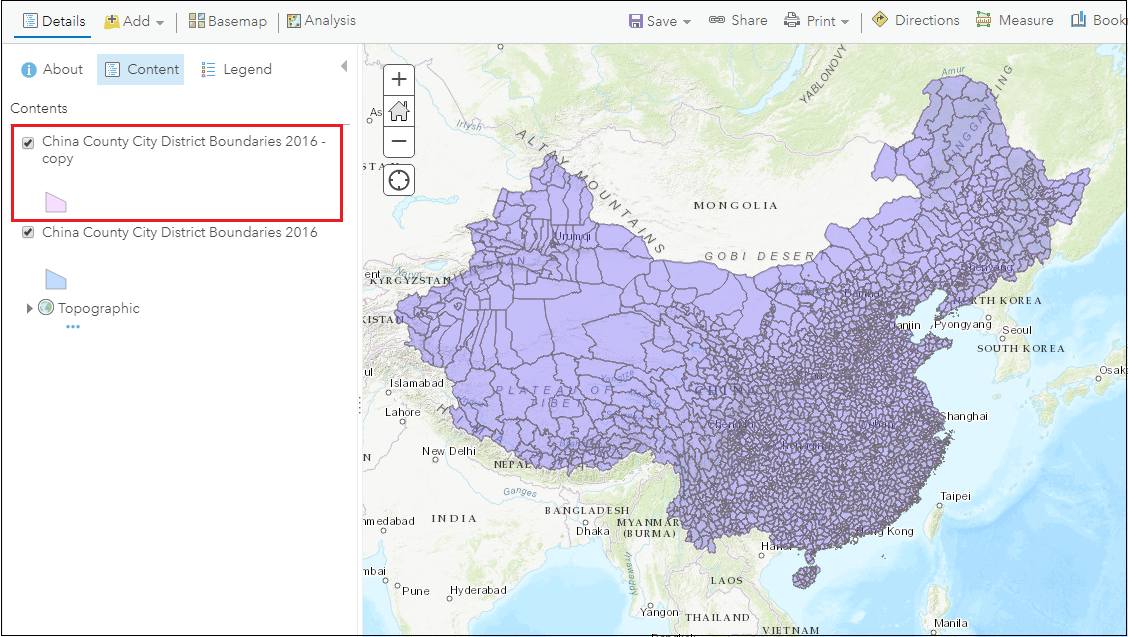
- In ArcGIS Online, copy the polygon layer in Contents. The copy is generated on top of the original layer and is symbolized on the map.
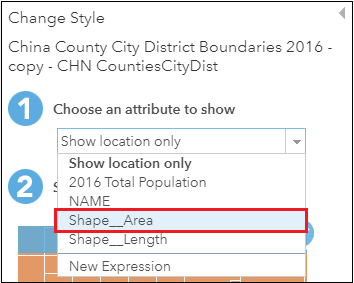
- Click the Change Style icon
 of the copied layer. In the Choose an attribute to show field, select a numeric field from the drop-down menu.
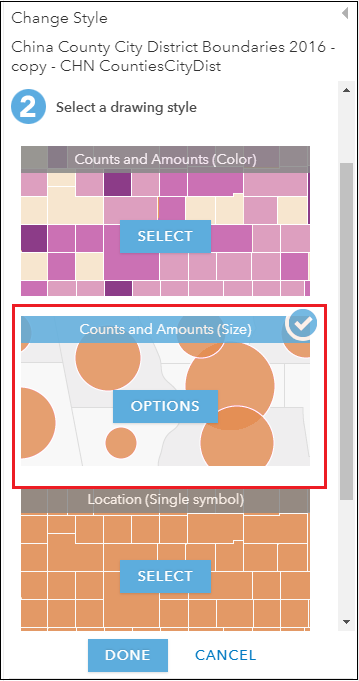
- For the Select a drawing style field, select the Counts and Amounts (Size) option. For more information on selecting styles in ArcGIS Online, refer to ArcGIS Online: Change Style.
Note:
Only the Counts and Amounts (Size) option allows representation of features as points. Other drawing style options symbolize the layer as polygons. Selecting this option is possible only when a numeric field is selected in the previous step.
- Click OPTIONS. In the Size section, select the Specify size range option. Specify Min and Max values.
Note:
Specify the points size range so the points do not look cluttered when the map zooms out. To create uniform-sized points across the map, specify the same value for Min and Max values.
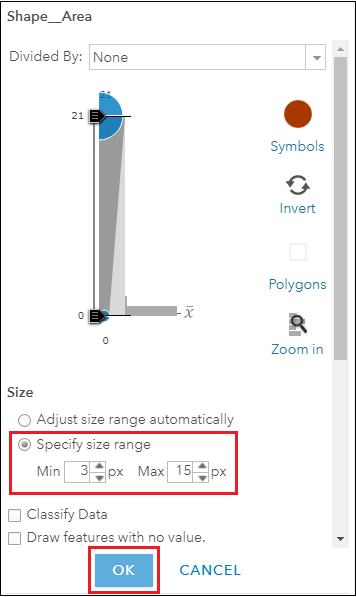
- Click OK > DONE. The image shows point features of the copied layer and polygon features of the original layer.
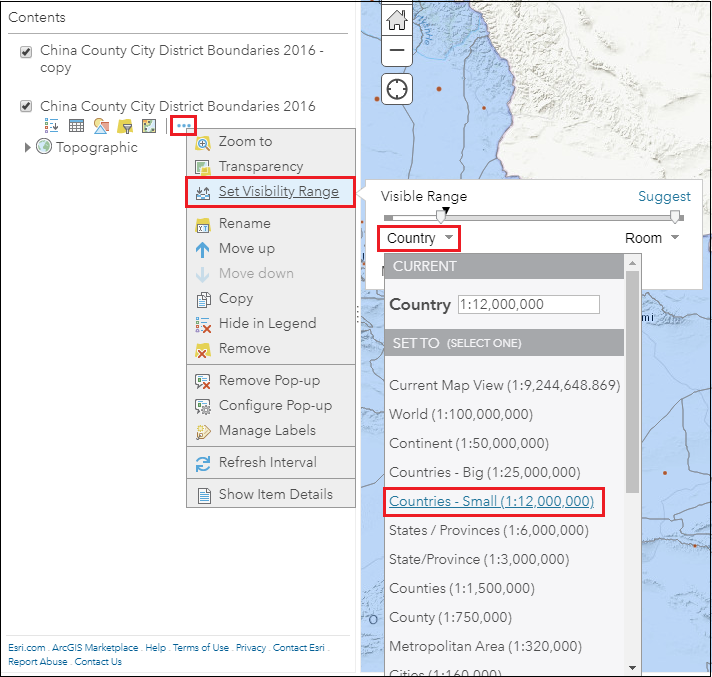
- For the original polygon layer, set a relatively large scale visibility range to view polygon features when the map zooms in. Click the More Options icon
 and select Set Visibility Range. Specify the visibility range by either sliding the scales (maximum to minimum) or choosing from the drop-down menu at both ends of the scale. The visibility range of the polygon layer in the image below is from the minimum end until 1:12,000,000.
The map label is set to appear at the minimum map scale until 1:6,000,000; the original polygon layer is set to appear at the minimum map scale until 1:12,000,000; and the copied point layer is set to appear at 1:12,000,000 until the maximum map scale. The images below show data presented on the map at different map scales:
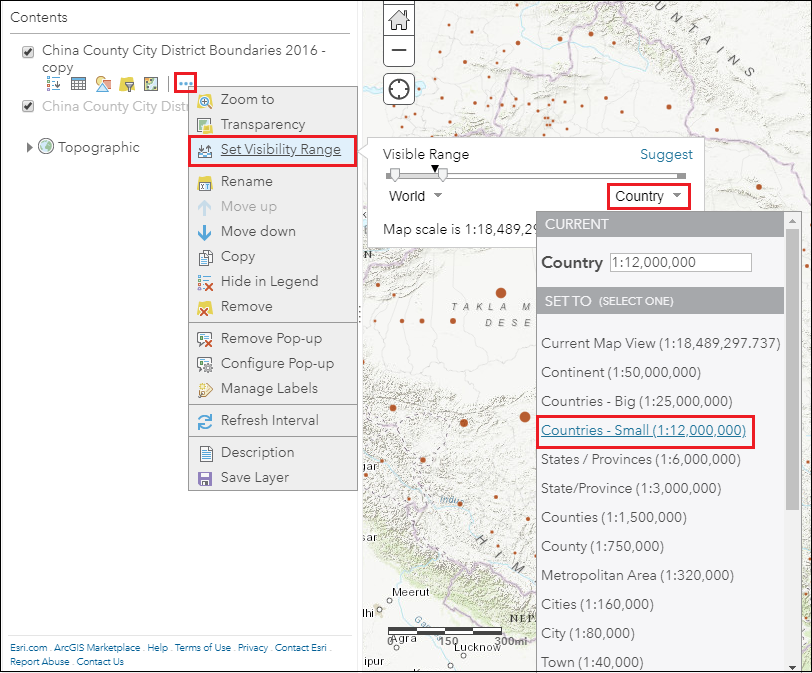
- For the copied point layer, set a relatively small scale visibility range to view point features when the map zooms out. The visibility range of the point layer in the image below is 1:12,000,000 until the maximum end.
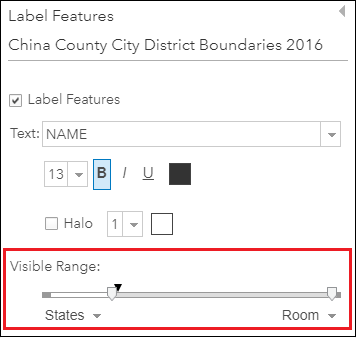
Note:
To include labels within a specified map scale, click the More Options icon and select Manage Labels. Specify the Visible Range field and click OK. In this example, the map scale for the original polygon layer is set from the minimum end until 1:6,000,000.
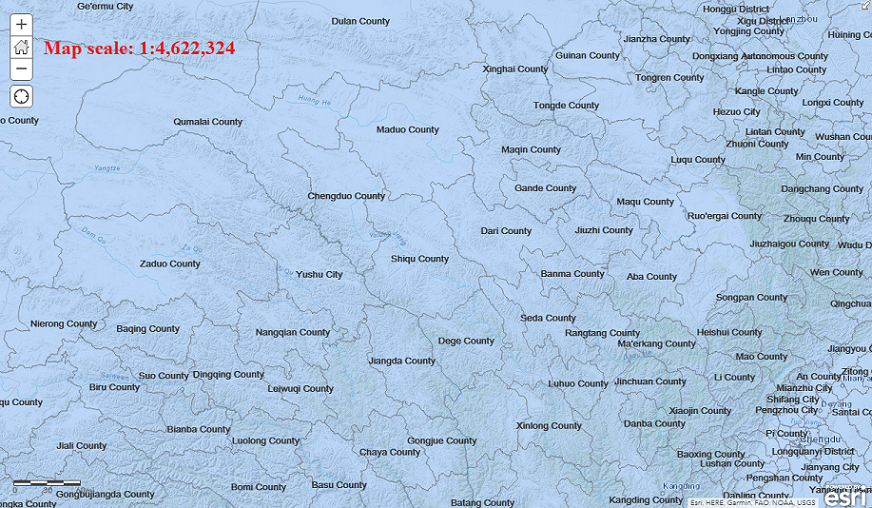
- At the 1:4,622,324 map scale, polygon features and map labels appear.
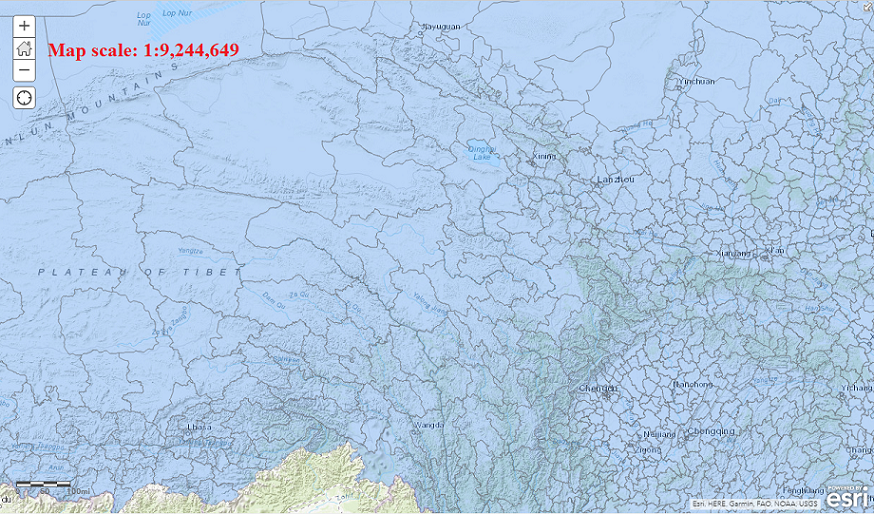
- At the 1:9,244,649 map scale, only polygon features appear.
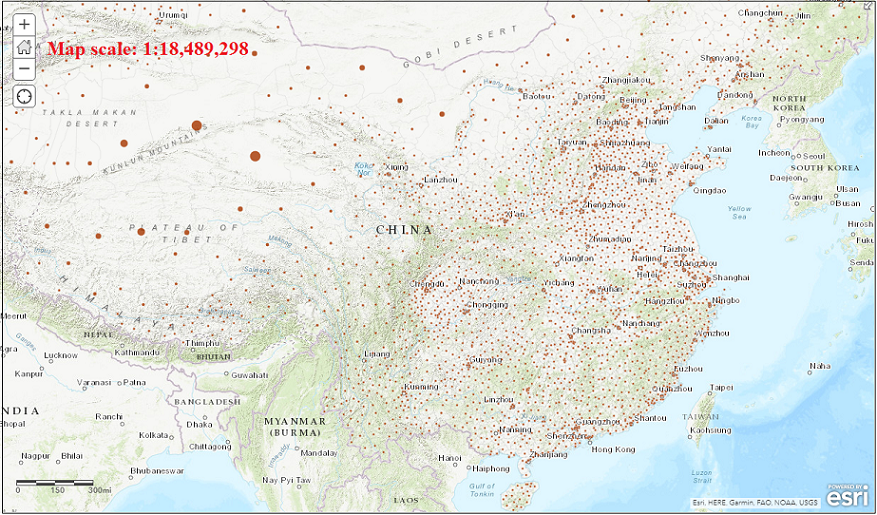
- At the 1:18,489,298 map scale, only point features appear.
Article ID: 000019473
- ArcGIS Online
Get support with AI
Resolve your issue quickly with the Esri Support AI Chatbot.


Related Information
Discover more on this topic
Search for related information
Find training related to this topic
Explore ideas and give feedback
Get help from ArcGIS experts
Start chatting now