PROBLEM
Merging rasters intersected by the International Date Line produces a gap
Description
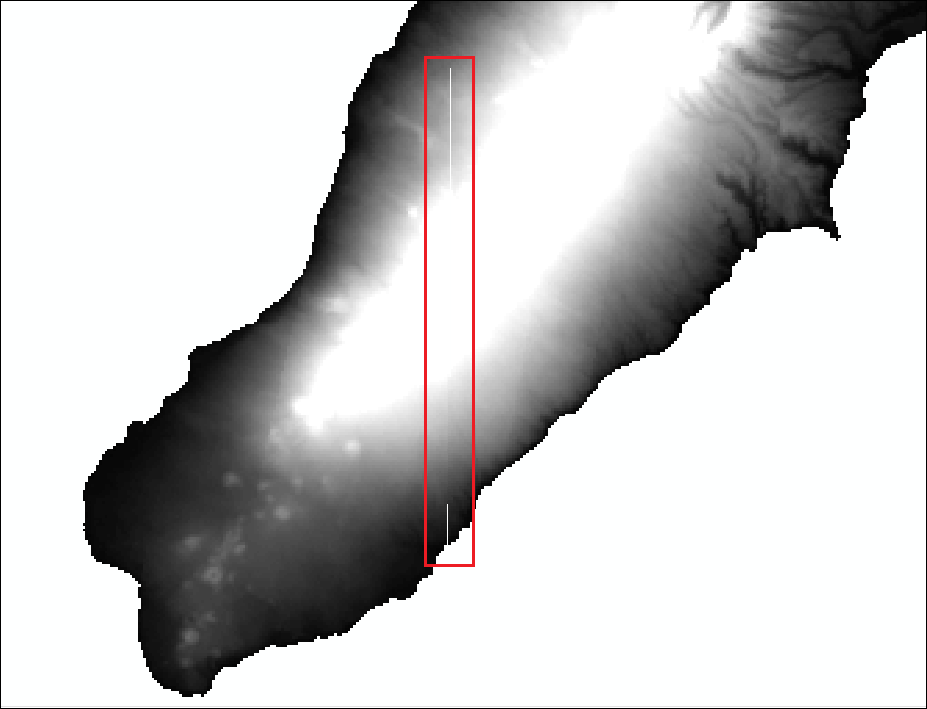
Merging rasters intersected by the International Date Line (IDL) in a geographic coordinate system produces an output raster with a gap. The following image is an example of this:
Cause
When ArcMap displays raster data in a geographic coordinate system, there is a discontinuity at the IDL. Identifying and handling rasters that intersect the IDL may have an impact on merged rasters. For more information on what happens to data that intersect the IDL, refer to this document: What happens to features at +/-180 (dateline)?
Solution or Workaround
The following instructions describe how to merge rasters that intersect the IDL without producing a gap in the output raster.
- Use the Project Raster tool to project the rasters to a projected coordinate system. In the Catalog window, navigate to Data Management Tools > Projections and Transformations > Raster > Project Raster. Repeat this step for all rasters.
- Under Input Raster, browse to the raster to project.
- Under Output Raster Dataset, set a name and location for the projected raster.
- Under Output Coordinate System, select a projected coordinate system for the raster.
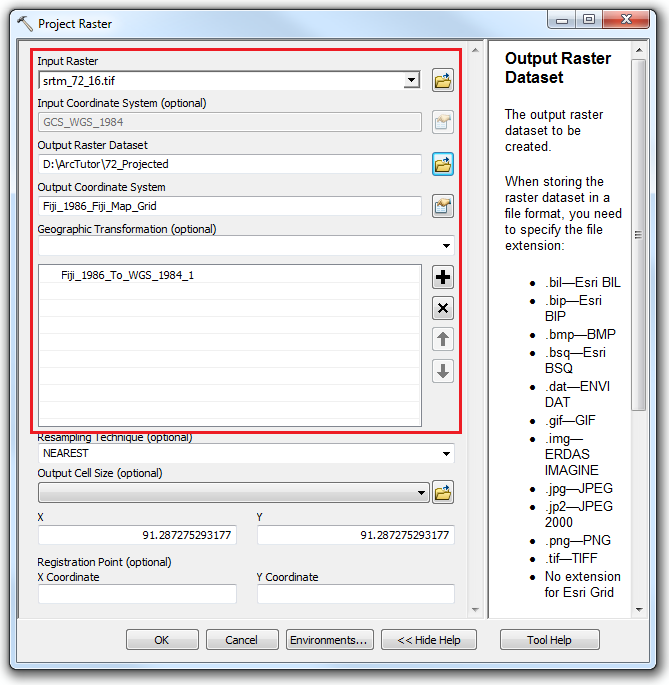
- Click OK. The projected raster is added to the map.
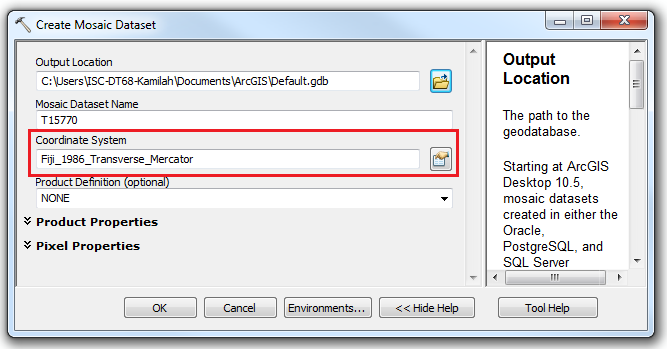
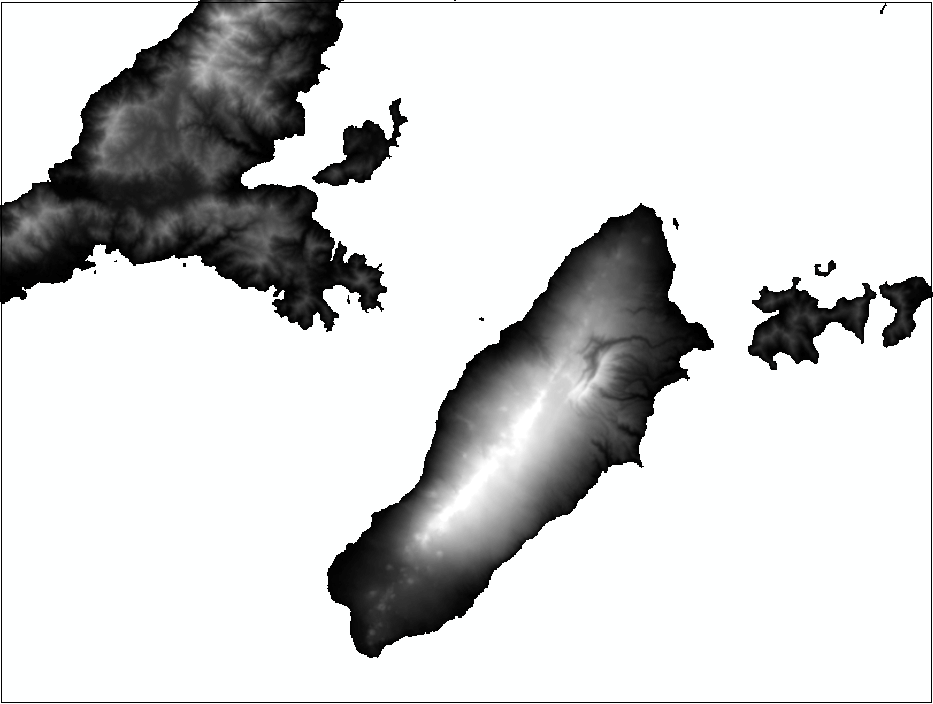
- Create a mosaic dataset in a file geodatabase. Add the projected rasters to this dataset. Refer to Creating mosaic dataset basics for these steps.
Select the same Coordinate System parameter used for the projected rasters when creating the mosaic dataset.
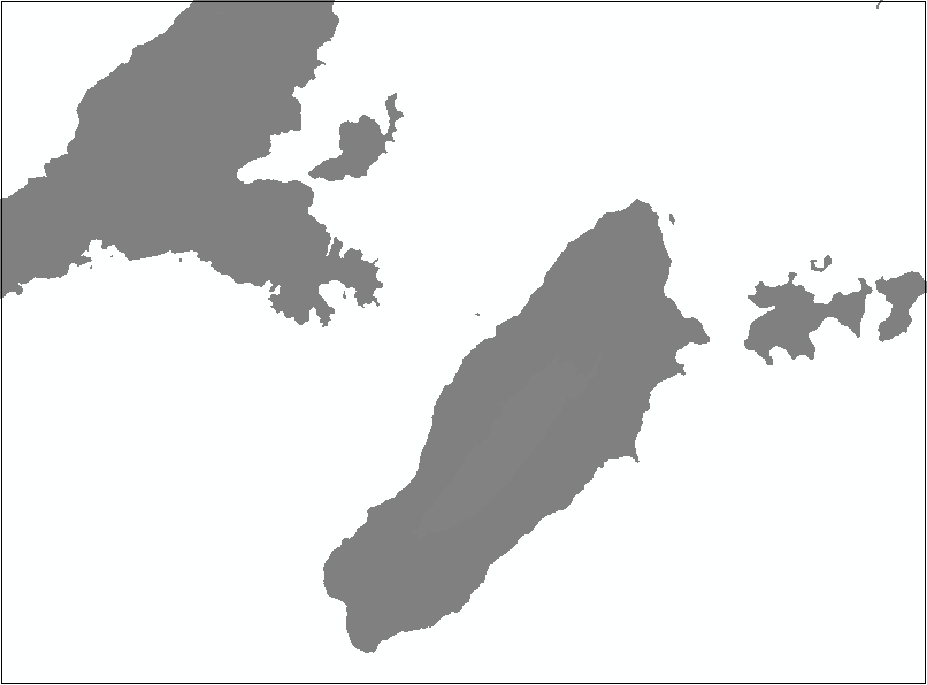
The following image displays the rasters added to the mosaic dataset:
- Use the Calculate Statistics tool to properly stretch and symbolize the raster data for display. In the Catalog window, right-click the mosaic dataset, and click Enhance > Calculate Statistics to open the Calculate Statistics dialog box.
- Under Input Raster Dataset, browse to the mosaic dataset that stores the projected rasters.
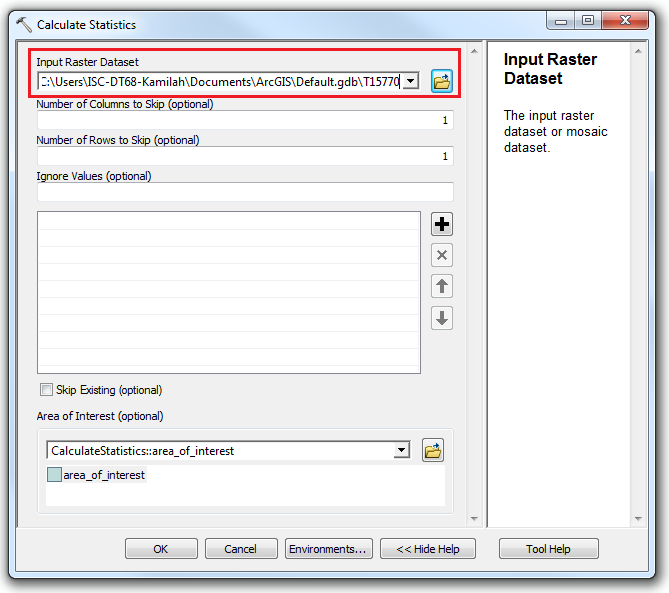
- Leave the other parameters in the Calculate Statistics dialog box at the default settings. Click OK.
- Under Input Raster Dataset, browse to the mosaic dataset that stores the projected rasters.
- Use the Define Overviews and Build Overviews tools to define and build overviews on the mosaic dataset.
- In the Catalog window, right-click the mosaic dataset containing the raster datasets, and click Optimize > Define Overviews.
- Leave the other parameters in the Define Overviews dialog box at the default settings. Click OK.
- In the Catalog window, right-click the mosaic dataset containing the raster datasets, and click Optimize > Build Overviews.
- Leave the other parameters in the Build Overviews dialog box at the default settings. Click OK.
- This step is optional. For a better representation of raster dataset elevations, add the Hillshade function to the mosaic dataset using the Image Analysis window. Skip this step and proceed to Step 6 to export the output raster dataset from Step 4 to a desired raster format without the Hillshade function.
- Click Windows > Image Analysis.
- In the Image Analysis window, click Add Function
 .
. - In the Function Template Editor dialog box, right-click the mosaic dataset, and click Insert Function > Hillshade Function.
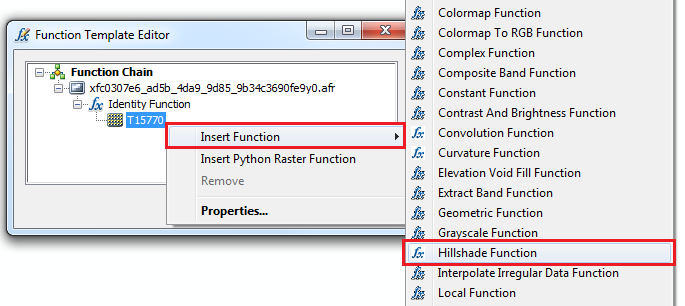
- Leave the other parameters in the Raster Function Properties dialog box at the default settings, and click OK.
- Click OK to close the Function Template Editor dialog box.
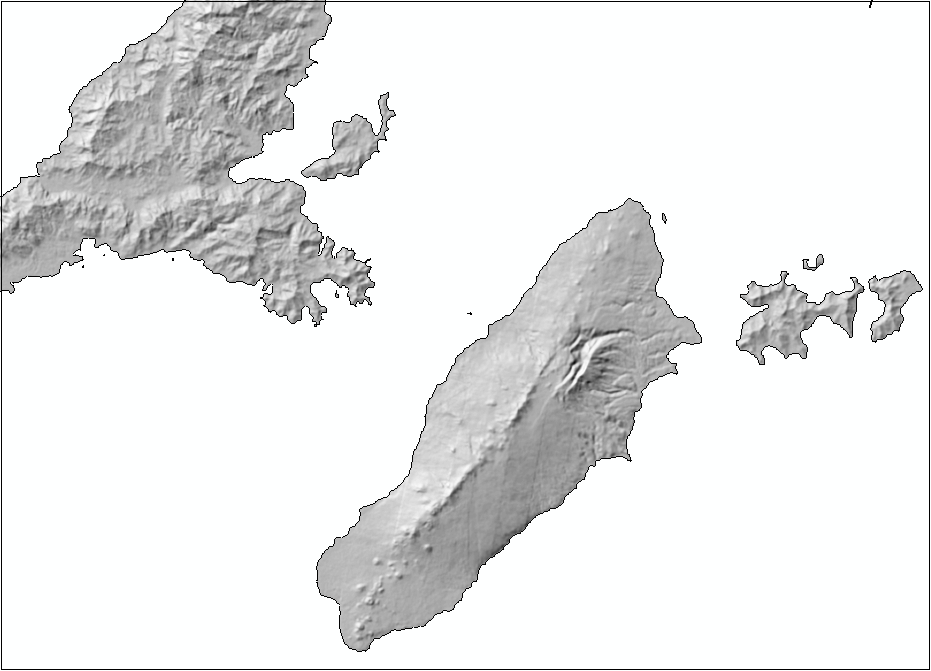
The following image displays the hillshaded raster dataset:
- Export the raster dataset to a desired file format using the Export button on the Image Analysis window. Refer to Using the Export button on the Image Analysis window for these steps.
Article ID: 000015770
- ArcMap
Get support with AI
Resolve your issue quickly with the Esri Support AI Chatbot.


Related Information
Discover more on this topic
Search for related information
Find training related to this topic
Explore ideas and give feedback
Get help from ArcGIS experts
Start chatting now