Frequently asked question
What are the considerations for thermal imagery processing and analysis in Site Scan Manager for ArcGIS?
Along with RGB cameras, Site Scan Manager for ArcGIS can process thermal imagery from compatible drones and thermal sensors. These hardware specifications are outlined in detail in FAQ: What is required for thermal mapping in Site Scan Flight for ArcGIS?. The considerations for adding thermal imagery to Site Scan for ArcGIS are discussed below, along with an overview of the analysis tools in the application.
As wireless transfer is not possible for thermal images, after thermal images are collected with the drone, the images must be taken from the SD card, added to a file location on a computer used for processing the imagery, and uploaded to Site Scan Manager. Once the photos are ready for processing, log in to Site Scan Manager and, if necessary, create a new Project. If a Project for this flight exists, proceed to create a new flight to process the images. The workflow to upload photos outside of the Site Scan for ArcGIS Fight Planning app can be found in the article How To: Upload photos to Site Scan Manager for ArcGIS.
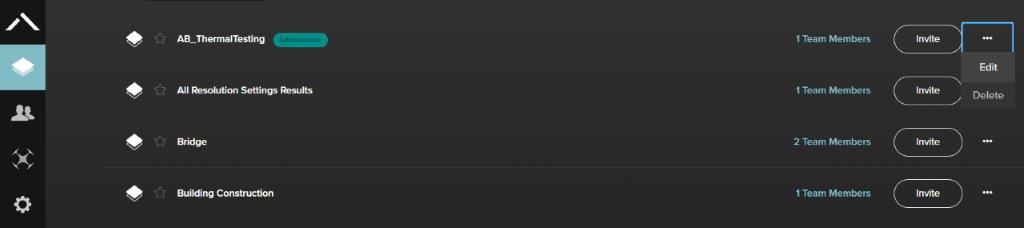
One important factor to note is the effect of the flight distance units on the temperature units of measure of the resulting thermal products. If the distance unit is set to Standard Foot or U.S. Foot, the degree unit will be Fahrenheit, while a unit of "Meters" will set the degree unit to Celsius. Though these units are set at flight creation, they can be modified at any time by navigating to All Projects, and selecting the ellipsis to the right of the flight name to open the Edit option, where the units can be changed as desired, modifying both the distance and the temperature units of measure.
Inspection and Export Options for Thermal Imagery
Once the thermal products are created, there are several available options for inspection and export within Site Scan Manager. In Site Scan Manager, the thermal product can be toggled on and off within the Layers tab, using the button to the right of the layer name. Expanding the Thermal section reveals a graph showing a visual representation of the temperature range of the thermal product. The colors of the graph are the colors of the chosen color palette. There are two available color palettes: Inferno and Turbo, with Inferno being the default. Temperature range is also shown in degrees just below the graph. Opacity can also be modified for multilayered analysis.
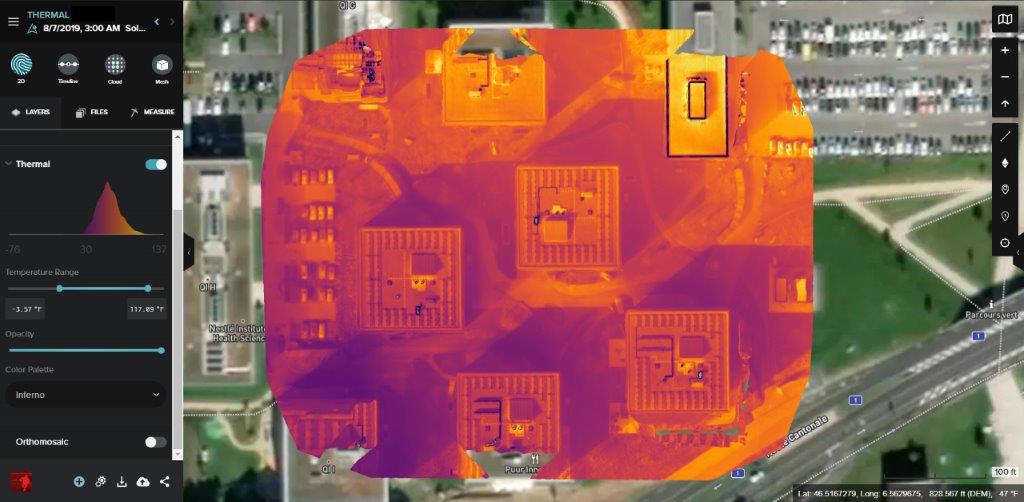
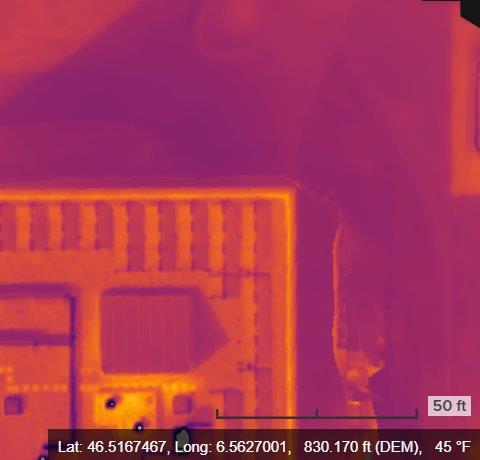
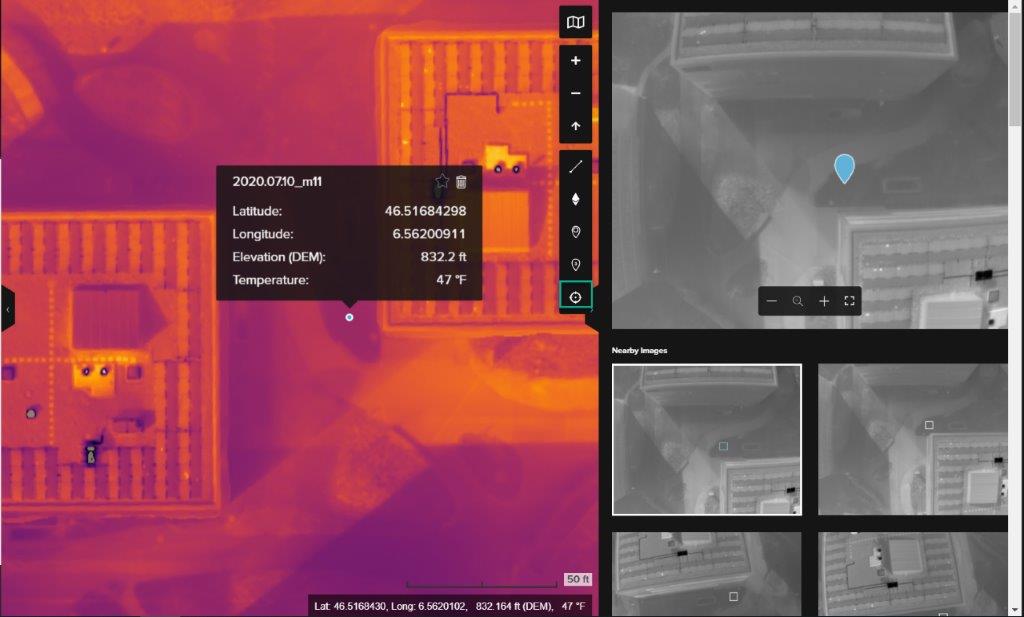
The product can be inspected in a variety of ways. By default, moving the mouse across the product will reveal information about the area of the product under the mouse, presented in the lower right corner of the screen. The latitude, longitude, elevation, and temperature of this particular area are shown in this bar.
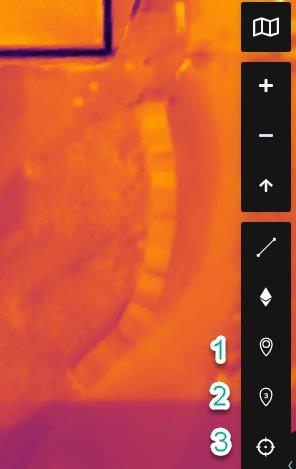
The three primary inspection tools available in Site Scan Manager are the Marker (1), Counter (2), and Inspect Photo (3) tools. These are located to the right-hand side of the screen, aligned vertically, as shown in the following image.
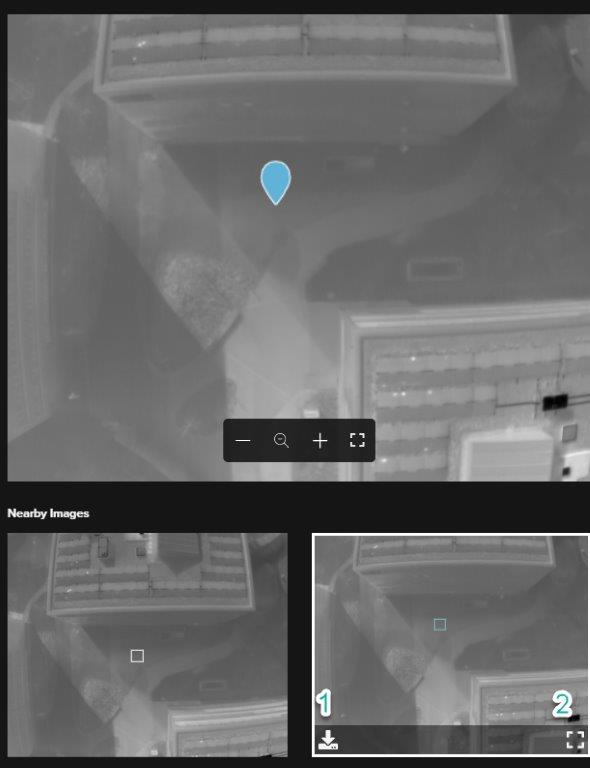
Inspect Photo allows the inspection of the individual photos that comprise the thermal product. To activate, click the Inspect Photo symbol, which changes the mouse symbol from a hand to crosshairs. Selecting the desired point on the product identifies the photo at that location, along with adjacent photos. The Inspect Point marker presents as a blue location marker on the image.
Beneath the selected image, the Nearby Images section shows the adjacent images, with the exact point of the Inspect Photo marker is shown as a blue box in the selected adjacent photos. Each adjacent photo can be expanded or exported as an individual image (1), or expanded for a zoomed in view (2), by clicking the icons shown in the following image.
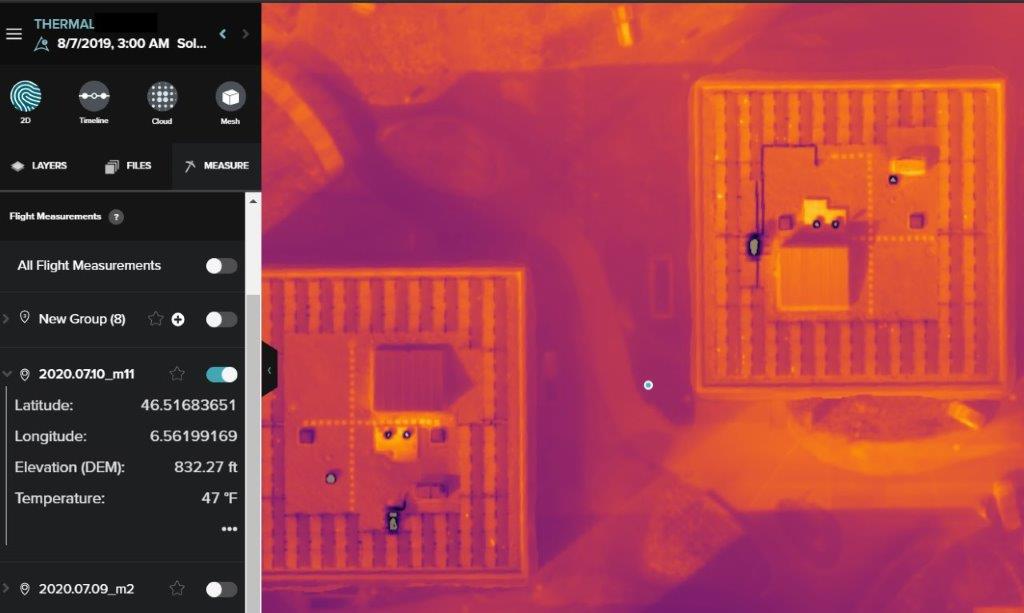
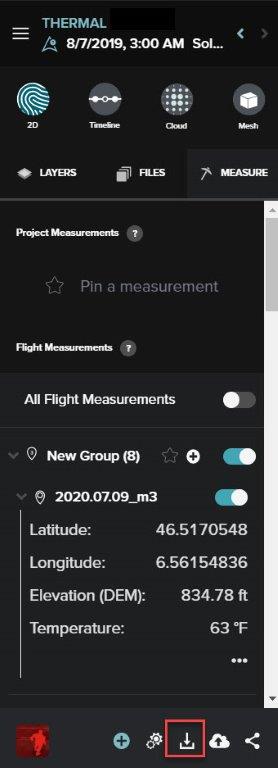
The Marker tool is used to display specific locations of interest in the product. Select the tool from the ribbon on the right side of the screen, and select the location of interest. The location will be revealed in the Measurements tab. Latitude, Longitude, Elevation from the DEM, and Temperature are all displayed for the individual marker, labeled by default with the date the marker was created.
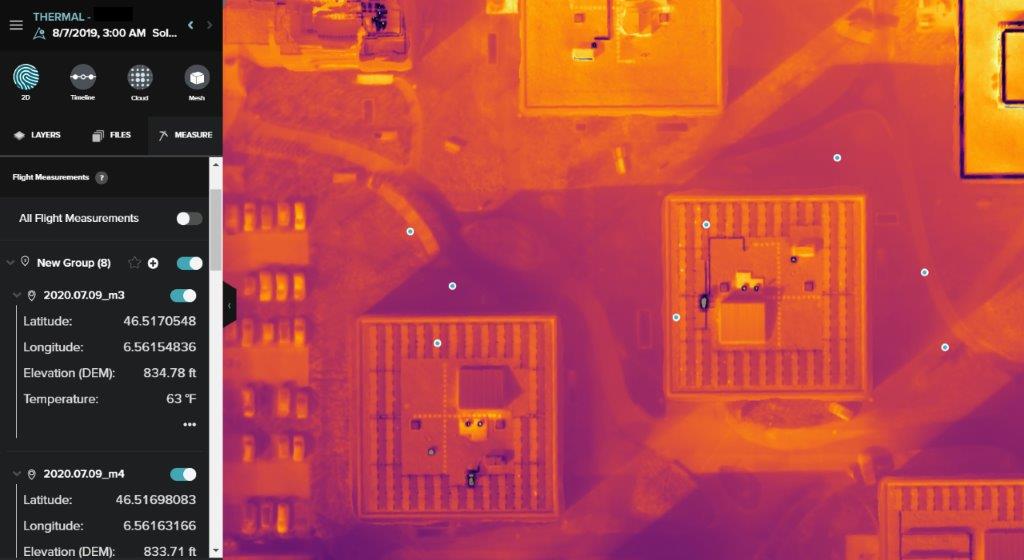
Similar to the Marker tool is the Counter tool. The Counter tool also allows for measurements of individual points, but this tool allows for multiple points to be added to a group. These points will also be displayed in the Measurements tab, with Latitude, Longitude, Elevation, and Temperature measurements for each marker.
Export options are found toward the lower section of the left-hand pane. All export options for products can be found by clicking the button with the down arrow. This presents the export options. All products can be exported to TIFF format, including the thermal map. A PDF can also be exported, which presents the measurement data from the Counter tool in a report format, with labeled points and a table of measurements.
Article ID: 000023749
- Site Scan Manager for ArcGIS
Get support with AI
Resolve your issue quickly with the Esri Support AI Chatbot.


Discover more on this topic
Search for related information
Find training related to this topic
Explore ideas and give feedback
Get help from ArcGIS experts
Start chatting now