PROBLEM
Unable to generate reports and infographic results in ArcGIS Business Analyst Web App
Description
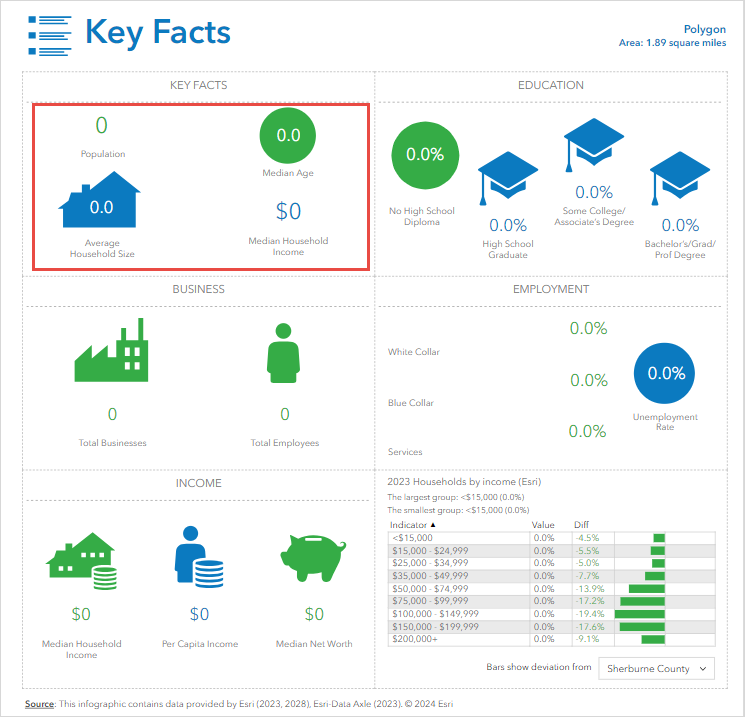
When attempting to generate reports and/or infographics in ArcGIS Business Analyst Web App by defining areas using Draw Polygon, the generated report or infographic results do not contain any data based on the polygon drawn on the web layer. The image below shows the infographic result using the Key Facts infographic template generated from a Draw Polygon method with no data generated under the Key Facts panel.
Cause
- The density of the demographic data on the map is low. Urbanized areas contain an abundance of demographic data, while rural areas lack such information. Therefore, results cannot be produced for the infographics or report. An urban area can be defined as densely populated areas, such as housing areas, whereas a rural area typically has a lower population density, such as the countryside.
- The size of the polygon covering the area of interest is small and determines whether the data is present in the report or infographic results. A smaller polygon area, with a minimum total area size of 0.03 square miles covering the area of interest, results in no demographic data being retrieved for the report or infographic results.
Solution or Workaround
Define the area where demographic data is available
Choose an area where demographic data is available to be able to generate results in the infographics and report. Refer to Esri Location Data: What's new in Esri Demographics for updates regarding Esri demographic data.
Generating reports and infographics by using Draw Polygon for polygons or lines
Generate the report or infographics by creating sites using the Draw Polygon method. Refer to ArcGIS Business Analyst: Draw a polygon for further instructions. Ensure the area of the polygon drawn is bigger than the size of the polygon or line web layer.
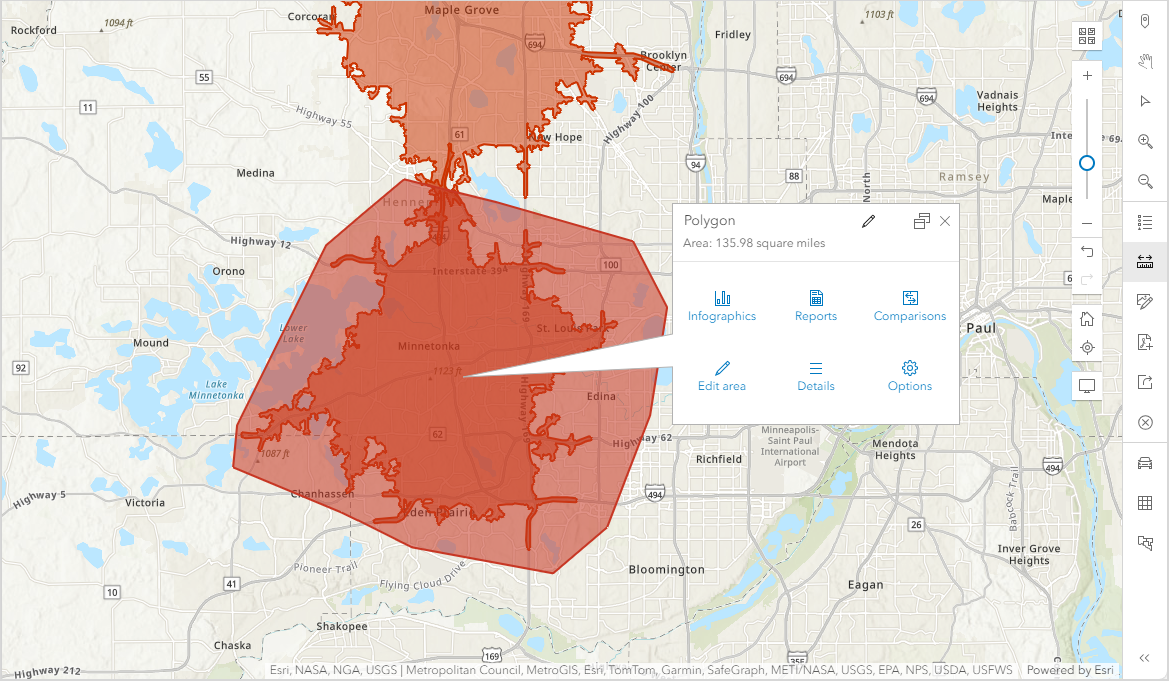
The image below shows the polygon drawn is bigger than the size of the polygon web layer when creating sites.
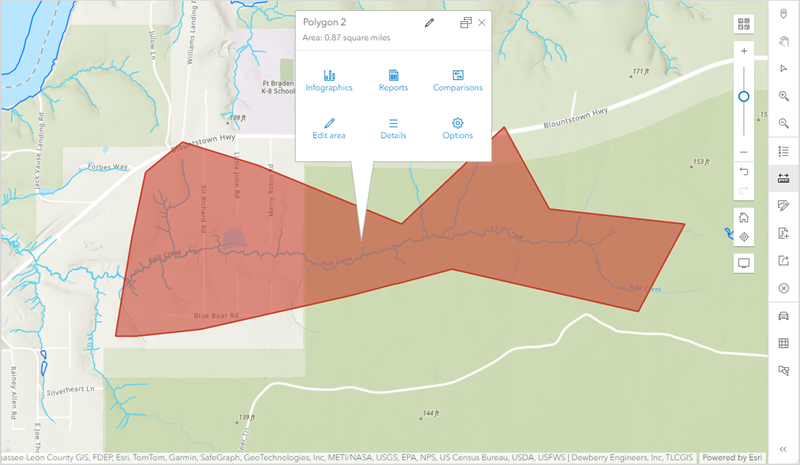
The image below shows the polygon drawn is bigger than the size of the line web layer when creating sites.
Generating reports and infographics by defining areas using Draw Polygon for points
The following is the workflow for using the Draw Polygon method to generate reports or infographics to address the size of the polygon area for web layers containing points.
- Open ArcGIS Business Analyst Web App and open the desired project.
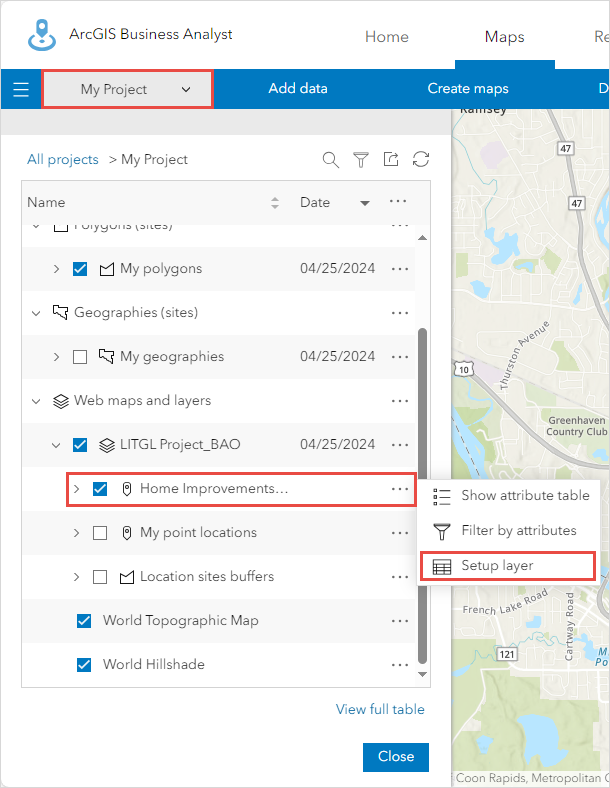
- On the Maps tab, expand the name of the project to view the content of the project. In this example, the name of the project is My Project.
- In the Web maps and layers window, click the Options button
 of the desired point and click Setup layer. In this example, the name of the layer is 'Home Improvements Centers over $4M'.
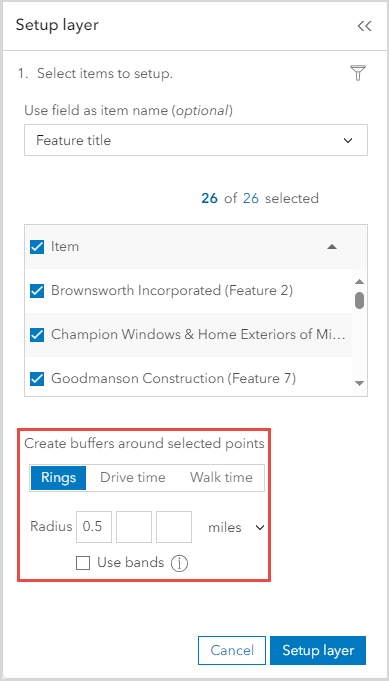
- In the Setup layer pane, under Create buffers around selected points, select Rings.
- In the Radius section, delete the content of the three number input boxes and type the desired number while ensuring the number is greater than 0.03 in the first box from the left. In this example, 0.5 is specified. Leave the other configuration parameter as-is.
Note:
The three number input boxes represent the buffer ring sizes. By default, buffer rings of 1, 3, and 5 miles are created.
- Click Setup layer > I’m done.
- On the Maps tab, click Define areas > Draw polygon.
- In the Draw polygon pane, click to choose either one of the following drawing methods:
- For Polygon, do the following:
- Click the map to start drawing, move to the next point, and click.
- Continue clicking at each corner of the shape until the polygon is created.
- Double-click to stop drawing.
- For Freehand, do the following:
- Click and drag the cursor to draw a shape.
- Release the mouse button to stop drawing.
The following image shows Polygon chosen as the drawing method.
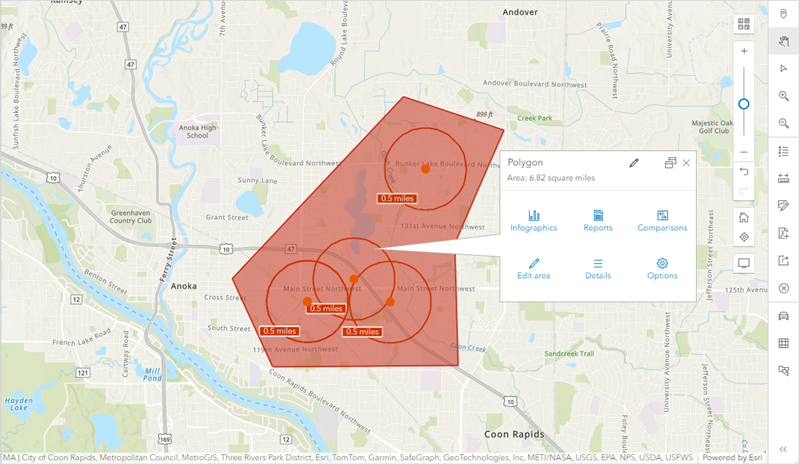
- In the pop-up of the polygon, click Infographics, expand the options of the infographics template, and select the desired infographics template.
- Click Run infographics and a preview of the infographic data is shown.
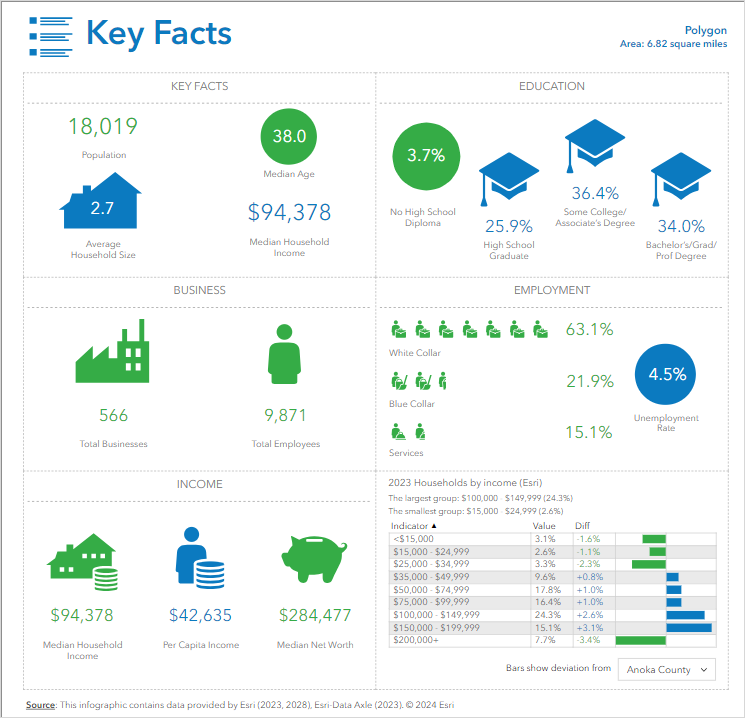
The image below shows the infographic results using the Key Facts template based on the sites created using the Draw Polygon method.
Article ID: 000032526
- ArcGIS Business Analyst Web App
Get support with AI
Resolve your issue quickly with the Esri Support AI Chatbot.


Related Information
Discover more on this topic
Search for related information
Find training related to this topic
Explore ideas and give feedback
Get help from ArcGIS experts
Start chatting now