HOW TO
Enhance SAR data for use in ArcGIS Pro
Summary
Synthetic aperture radar (SAR) data is a reliable remote sensing tool to capture detailed surface information under various weather or lighting conditions. However, SAR data is often obscured by noise, making visual interpretation challenging. In some cases, SAR data is not represented accurately on the map when applying symbology, such as linear stretch, due to the noise. Therefore, the SAR data must be enhanced for accurate representation and to improve visual clarity.
This article describes the workflow to enhance SAR data for use in ArcGIS Pro.
Procedure
Note:
The workflow requires an ArcGIS Image Analyst license.
- Open the ArcGIS Pro project.
- Add a folder connection containing the SAR data in ArcGIS Pro. Refer to ArcGIS Pro: Connect to an existing folder for instructions.
- Add the SAR data from the folder connection to the map. Refer to ArcGIS Pro: Add data from a folder for instructions.
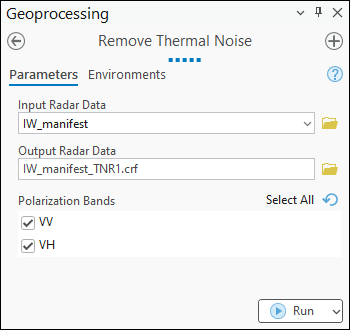
- Correct the thermal noise in the SAR data using the Remove Thermal Noise tool.
- On the Analysis tab, in the Geoprocessing group, click Tools.
- In the Geoprocessing pane, search for and click Remove Thermal Noise (Image Analyst Tools).
- In the Remove Thermal Noise pane, for Input Radar Data, select the SAR data from the drop-down list.
- For Output Radar Data, specify a name and location.
- For Polarization Bands, check the preferred band check box.
- Click Run.
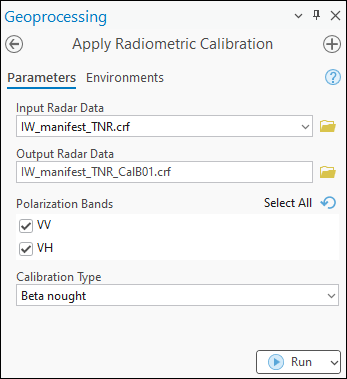
- Convert the raw pixel values into calibrated values using the Apply Radiometric Calibration tool.
- In the Geoprocessing pane, search for and click Apply Radiometric Calibration (Image Analyst Tools).
- For Input Radar Data, select the output SAR data in Step 4 from the drop-down list.
- For Output Radar Data, specify a name and location.
- For Polarization Bands, check the preferred band check box.
- For Calibration Type, select Beta nought from the drop-down list.
- Click Run.
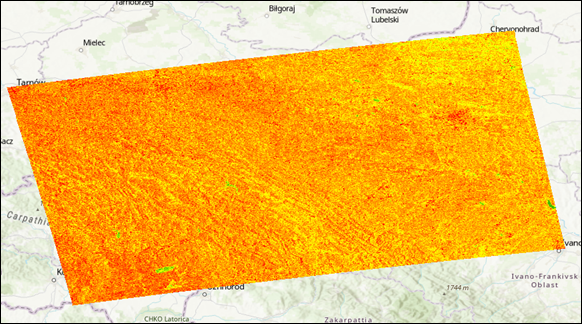
The map below displays the output SAR data after the enhancement. In this example, a linear stretch is applied to data.
Article ID: 000034291
- ArcGIS Pro 3 3
- ArcGIS Pro 3 2
- ArcGIS Pro 3 4
Get support with AI
Resolve your issue quickly with the Esri Support AI Chatbot.


Related Information
Discover more on this topic
Search for related information
Find training related to this topic
Explore ideas and give feedback
Get help from ArcGIS experts
Start chatting now