HOW TO
Create contour lines based on values other than elevation points
Summary
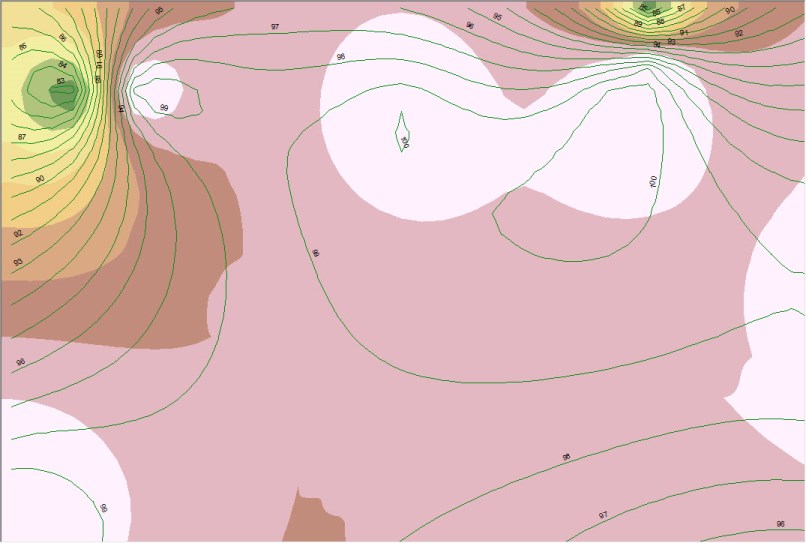
Other than elevation, contouring can be used to graphically represent data based on values such as soil temperature, isobars or lithic counts, and model the potential change between any two points. For example, the user has point data on a map representing the lithic (rock) material found at each survey point. Contour lines can be created by attributing each point to the lithic count amounts.
Note:
Overall contour accuracy depends on how well the data used to create the input raster represents the actual surface. Therefore it is important to evaluate the data and its purpose to avoid accuracy issues in data representation.
The instructions provided describe how to create contour lines from point features.
Procedure
- Interpolate the point to raster using one of the surface interpolation methods such as IDW, Kriging, Natural Neighbor, and Topo To Raster to create an elevation surface from a set of point data. Refer to ArcMap: Comparing interpolation methods for more information on the available interpolation methods in ArcMap.
Note:
If the Topo To Raster tool is used, set PointElevation as the Type parameter. Topo To Raster does not support shapefiles as the input feature. The tools used to interpolate data to raster require the Spatial Analyst or 3D Analyst license.
- Use the Contour tool.
- In the Catalog window, navigate to System Toolboxes > Spatial Analyst Tools > Surface > Contour.
Note:
For 3D Analyst, navigate to System Toolboxes > 3D Analyst Tools > Raster Surface > Contours.
- Select the output from Step 1 as the input raster.
- Specify the name and location of the output polyline features.
- Set the contour interval value.
- Click OK.
Note:
Refer to ArcMap: Contour for more information on how to use the Contour tool.
Article ID: 000014278
- ArcMap
Get support with AI
Resolve your issue quickly with the Esri Support AI Chatbot.


Related Information
Discover more on this topic
Search for related information
Find training related to this topic
Explore ideas and give feedback
Get help from ArcGIS experts
Start chatting now