HOW TO
Create a web map from a JSON file using ArcGIS API for Python version 2.3 and prior
Summary
In some cases, it is favorable to create a web map using a script, as it can be programmed for multiple web maps. Using the definition specified in a JSON file, the gis.content.add function in ArcGIS API for Python version 2.3 and prior can be used to create the web map.
Procedure
Web maps can be created from a JSON file representation using the gis.content.add function in the GIS module. There are two ways to do :
- Reading the JSON file within the script.
- Defining the JSON description in the script.
Note:
Defining the JSON description is a longer process. However, it gives the user the ability to modify the JSON representation of the script.
The steps below describe how to create a web map from a JSON file by reading it using the json module.
-
Import the necessary modules.
from arcgis.gis import GIS
from arcgis.mapping import WebMap
import json
- Specify the login credentials.
gis = GIS('https://<machine>.<domain>/<web adaptor name>/home', 'username', 'password', verify_cert=False)
print ('Connected')
- Open the JSON file.
with open('/home/jupyter/test2.json') as json_data:
	data = json.load(json_data)
- Create the new map.
item_properties_dict = {"type": "Web Map","title": "Test Map","tags": ["test","test1","test2"],"snippet":"This is a snippet", "text":data}

newmap = gis.content.add(item_properties = item_properties_dict)
newmap
The following shows the full script:
from arcgis.gis import GIS
from arcgis.mapping import WebMap
import json

gis = GIS('https://<machine>.<domain>/<web adaptor name>/home', 'username', 'password', verify_cert=False)
print ('Connected')

with open('/home/jupyter/test2.json') as json_data:
	data = json.load(json_data)

item_properties_dict = {"type": "Web Map","title": "Test Map","tags": ["test","test1","test2"],"snippet":"This is a snippet", "text":data}

newmap = gis.content.add(item_properties = item_properties_dict)
newmap
The steps below describe how to create a web map by defining the JSON description in the script.
- Follow steps 1 and 2 from the method above.
- Define the dictionary containing the JSON used to create the web map.
data = {
	"operationalLayers": [{
			"id": "layer_2382",
			"layerType": "ArcGISMapServiceLayer",
			"url": "https://sampleserver6.arcgisonline.com/arcgis/rest/services/Census/MapServer",
			"visibility": True,
			"opacity": 1,
			"title": "Census Data",
			"layers": [{
					"id": 0,
					"layerDefinition": {
						"source": {
							"type": "mapLayer",
							"mapLayerId": 0
						}
					},
					"name": "Census Block Points",
					"minScale": 99999.99998945338,
					"maxScale": 0,
					"parentLayerId": -1,
					"defaultVisibility": True
				}, {
					"id": 1,
					"layerDefinition": {
						"source": {
							"type": "mapLayer",
							"mapLayerId": 1
						},
						"drawingInfo": {
							"renderer": {
								"type": "simple",
								"label": "",
								"description": "",
								"symbol": {
									"color": [0, 0, 0, 0],
									"outline": {
										"color": [230, 230, 0, 255],
										"width": 0.39975000000000005,
										"type": "esriSLS",
										"style": "esriSLSSolid"
									},
									"type": "esriSFS",
									"style": "esriSFSSolid"
								}
							}
						}
					},
					"name": "Census Block Group",
					"minScale": 1000000,
					"maxScale": 0,
					"parentLayerId": -1,
					"defaultVisibility": True
				}, {
					"id": 2,
					"layerDefinition": {
						"source": {
							"type": "mapLayer",
							"mapLayerId": 2
						},
						"drawingInfo": {
							"renderer": {
								"type": "simple",
								"label": "",
								"description": "",
								"symbol": {
									"color": [0, 0, 0, 0],
									"outline": {
										"color": [230, 230, 0, 255],
										"width": 0.5625,
										"type": "esriSLS",
										"style": "esriSLSSolid"
									},
									"type": "esriSFS",
									"style": "esriSFSSolid"
								}
							}
						}
					},
					"name": "Detailed Counties",
					"minScale": 0,
					"maxScale": 0,
					"parentLayerId": -1,
					"defaultVisibility": True
				}, {
					"id": 3,
					"layerDefinition": {
						"source": {
							"type": "mapLayer",
							"mapLayerId": 3
						},
						"drawingInfo": {
							"renderer": {
								"type": "simple",
								"label": "",
								"description": "",
								"symbol": {
									"color": [0, 0, 0, 0],
									"outline": {
										"color": [230, 230, 0, 255],
										"width": 2,
										"type": "esriSLS",
										"style": "esriSLSSolid"
									},
									"type": "esriSFS",
									"style": "esriSFSSolid"
								}
							}
						}
					},
					"name": "states",
					"minScale": 0,
					"maxScale": 0,
					"parentLayerId": -1,
					"defaultVisibility": True
				}
			]
		}
	],
	"baseMap": {
		"baseMapLayers": [{
				"id": "labels",
				"layerType": "ArcGISTiledMapServiceLayer",
				"url": "https://services.arcgisonline.com/arcgis/rest/services/Canvas/World_Dark_Gray_Base/MapServer",
				"visibility": True,
				"opacity": 1,
				"title": "World_Dark_Gray_Base"
			}, {
				"id": "base",
				"layerType": "ArcGISTiledMapServiceLayer",
				"url": "https://services.arcgisonline.com/arcgis/rest/services/Canvas/World_Dark_Gray_Reference/MapServer",
				"visibility": True,
				"opacity": 1,
				"title": "World_Dark_Gray_Reference"
			}
		],
		"title": "Basemap"
	},
	"spatialReference": {
		"wkid": 102100,
		"latestWkid": 3857
	},
	"authoringApp": "WebMapViewer",
	"authoringAppVersion": "10.6.1",
	"version": "2.11"
}
- Create the new map.
item_properties_dict = {"type": "Web Map","title": "Test Map","tags": ["test","test1","test2"],"snippet":"This is a snippet", "text":data}

newmap = gis.content.add(item_properties = item_properties_dict)
newmap
The following shows the full script:
from arcgis.gis import GIS
from arcgis.mapping import WebMap

gis = GIS('https://<machine>.<domain>/<web adaptor name>/home', 'username', 'password', verify_cert=False)
print ('Connected')

data = {
	"operationalLayers": [{
			"id": "layer_2382",
			"layerType": "ArcGISMapServiceLayer",
			"url": "https://sampleserver6.arcgisonline.com/arcgis/rest/services/Census/MapServer",
			"visibility": True,
			"opacity": 1,
			"title": "Census Data",
			"layers": [{
					"id": 0,
					"layerDefinition": {
						"source": {
							"type": "mapLayer",
							"mapLayerId": 0
						}
					},
					"name": "Census Block Points",
					"minScale": 99999.99998945338,
					"maxScale": 0,
					"parentLayerId": -1,
					"defaultVisibility": True
				}, {
					"id": 1,
					"layerDefinition": {
						"source": {
							"type": "mapLayer",
							"mapLayerId": 1
						},
						"drawingInfo": {
							"renderer": {
								"type": "simple",
								"label": "",
								"description": "",
								"symbol": {
									"color": [0, 0, 0, 0],
									"outline": {
										"color": [230, 230, 0, 255],
										"width": 0.39975000000000005,
										"type": "esriSLS",
										"style": "esriSLSSolid"
									},
									"type": "esriSFS",
									"style": "esriSFSSolid"
								}
							}
						}
					},
					"name": "Census Block Group",
					"minScale": 1000000,
					"maxScale": 0,
					"parentLayerId": -1,
					"defaultVisibility": True
				}, {
					"id": 2,
					"layerDefinition": {
						"source": {
							"type": "mapLayer",
							"mapLayerId": 2
						},
						"drawingInfo": {
							"renderer": {
								"type": "simple",
								"label": "",
								"description": "",
								"symbol": {
									"color": [0, 0, 0, 0],
									"outline": {
										"color": [230, 230, 0, 255],
										"width": 0.5625,
										"type": "esriSLS",
										"style": "esriSLSSolid"
									},
									"type": "esriSFS",
									"style": "esriSFSSolid"
								}
							}
						}
					},
					"name": "Detailed Counties",
					"minScale": 0,
					"maxScale": 0,
					"parentLayerId": -1,
					"defaultVisibility": True
				}, {
					"id": 3,
					"layerDefinition": {
						"source": {
							"type": "mapLayer",
							"mapLayerId": 3
						},
						"drawingInfo": {
							"renderer": {
								"type": "simple",
								"label": "",
								"description": "",
								"symbol": {
									"color": [0, 0, 0, 0],
									"outline": {
										"color": [230, 230, 0, 255],
										"width": 2,
										"type": "esriSLS",
										"style": "esriSLSSolid"
									},
									"type": "esriSFS",
									"style": "esriSFSSolid"
								}
							}
						}
					},
					"name": "states",
					"minScale": 0,
					"maxScale": 0,
					"parentLayerId": -1,
					"defaultVisibility": True
				}
			]
		}
	],
	"baseMap": {
		"baseMapLayers": [{
				"id": "labels",
				"layerType": "ArcGISTiledMapServiceLayer",
				"url": "https://services.arcgisonline.com/arcgis/rest/services/Canvas/World_Dark_Gray_Base/MapServer",
				"visibility": True,
				"opacity": 1,
				"title": "World_Dark_Gray_Base"
			}, {
				"id": "base",
				"layerType": "ArcGISTiledMapServiceLayer",
				"url": "https://services.arcgisonline.com/arcgis/rest/services/Canvas/World_Dark_Gray_Reference/MapServer",
				"visibility": True,
				"opacity": 1,
				"title": "World_Dark_Gray_Reference"
			}
		],
		"title": "Basemap"
	},
	"spatialReference": {
		"wkid": 102100,
		"latestWkid": 3857
	},
	"authoringApp": "WebMapViewer",
	"authoringAppVersion": "10.6.1",
	"version": "2.11"
}

item_properties_dict = {"type": "Web Map","title": "Test Map","tags": ["test","test1","test2"],"snippet":"This is a snippet", "text":data}

newmap = gis.content.add(item_properties = item_properties_dict)
newmap
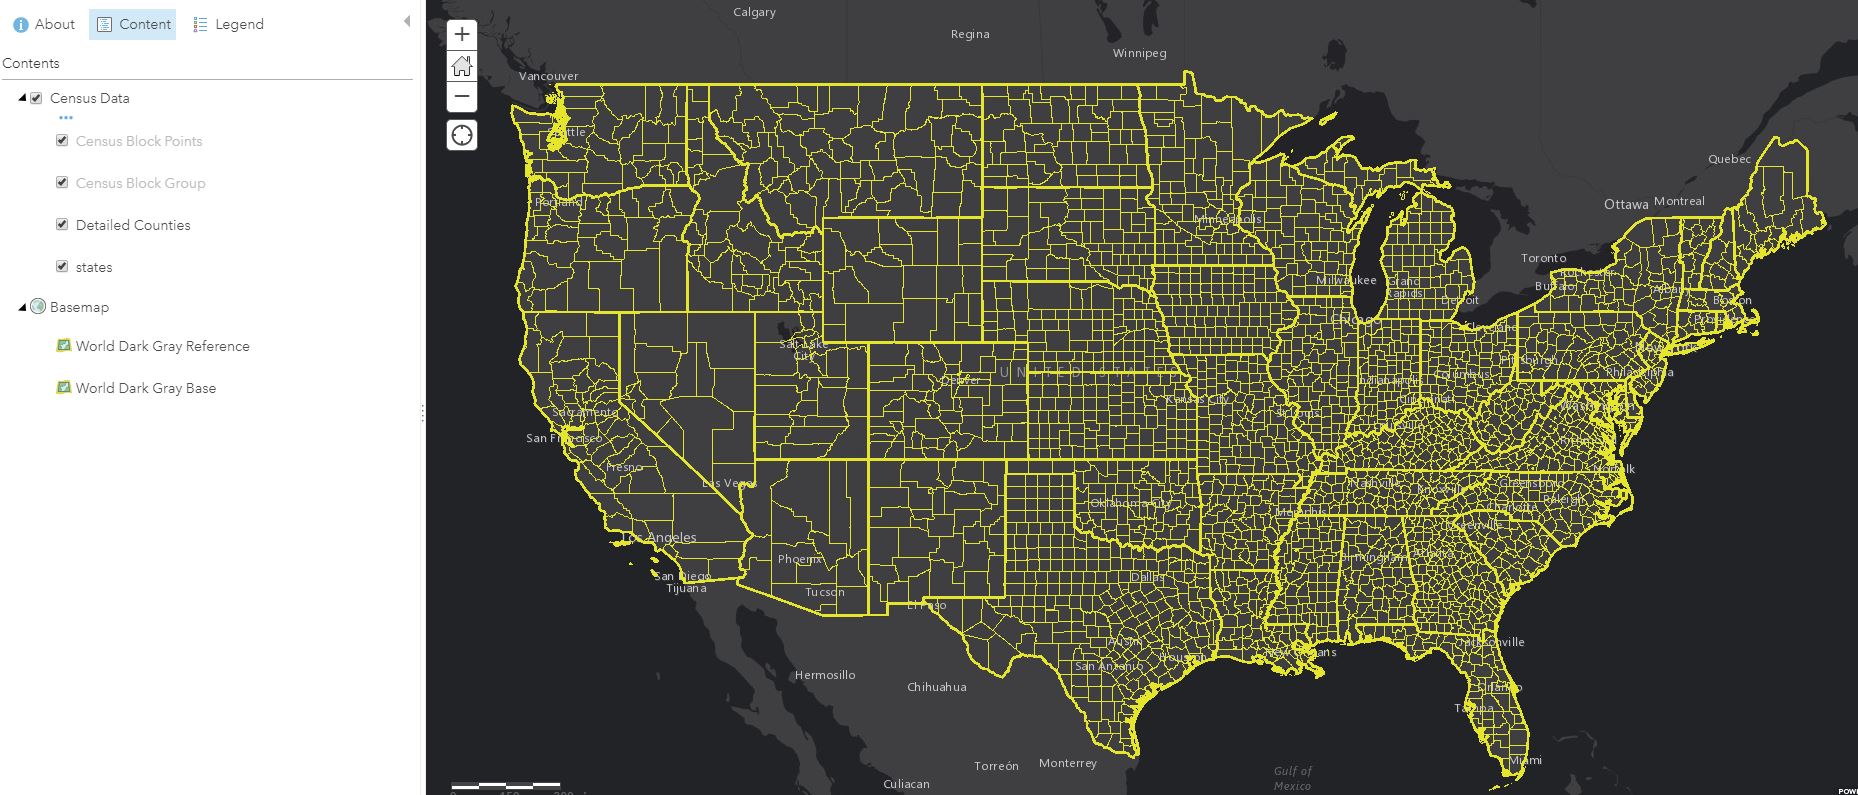
The image below shows the newly created web map.

Article ID: 000019701
- Portal for ArcGIS
- ArcGIS Server
- ArcGIS API for Python
Get help from ArcGIS experts
Start chatting now

