HOW TO
Configure a travel mode for cycling in ArcGIS Pro, ArcGIS Online, and an ArcGIS Enterprise Portal
Summary
'Configure Travel Modes' refers to identifying a method of travelling to define routes and travel areas within ArcGIS Pro, ArcGIS Online, and an ArcGIS Enterprise Portal. There are various models for analyzing automobile, truck, and walking behavior.
Currently, cycling is not a supported transport mode. This is because cycling is harder to model in terms of available routes. Some roads may either ban cyclists, or they may be difficult for cyclists to use safely. Alternatively, cyclists may not be able to traverse the same paths that walkers or joggers can.
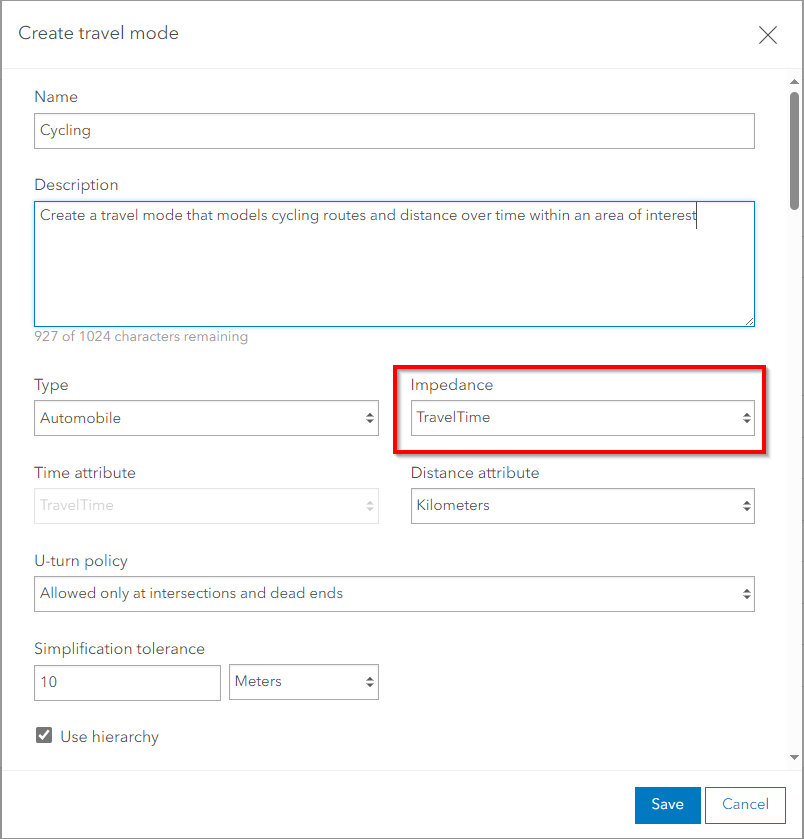
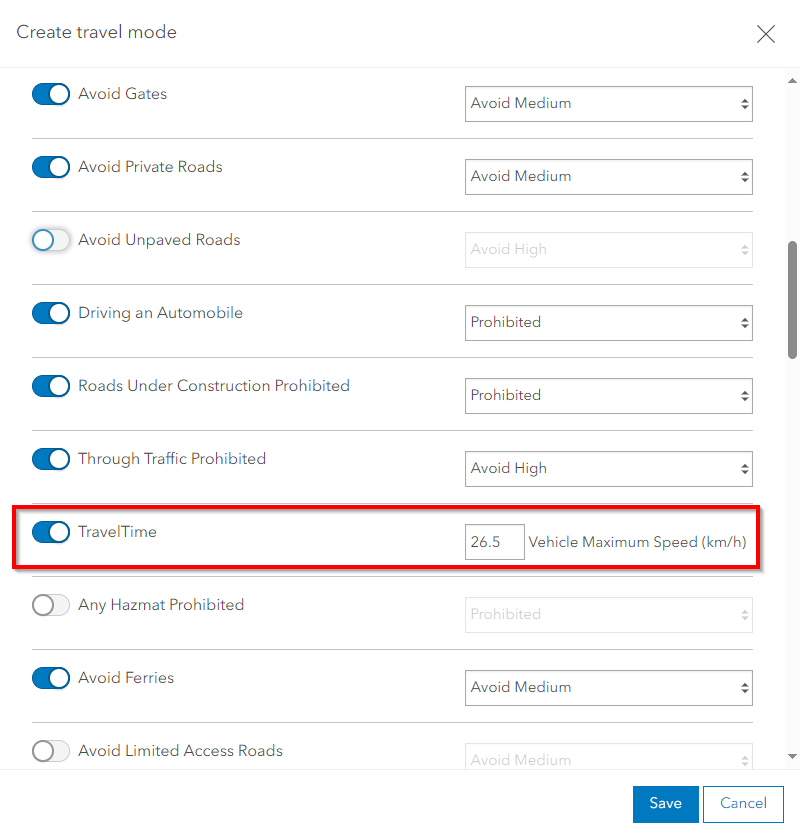
To create a custom travel mode that simulates cycling activity, you must update the TravelTime::Vehicle Maximum Speed parameter. Refer to the following resources to create a travel mode in ArcGIS Pro, ArcGIS Online, and ArcGIS Enterprise.
- ArcGIS Pro: Travel modes—ArcGIS Pro | Documentation
- ArcGIS Online: Configure travel modes—ArcGIS Online Help | Documentation
- ArcGIS Enterprise Portal: Configure travel modes—Portal for ArcGIS | Documentation for ArcGIS Enterprise
Procedure
Note:
To create, edit, or delete a travel mode, you must have privileges to manage the organization's utility service settings.
To determine the average cycling speed in the area of interest, update the TravelTime::Vehicle Maximum Speed (km/h) parameter to simulate bike speed, as shown in the next two images. Anecdotally, the average cycling speed is between 15-18 mph or 24-29 Km/h in the inner city, but individual observations may differ. See: ArcGIS Online: Configure travel modes
The following resource has some additional information about why cycling speed is not currently included as a transport mode. While there are indeed limitations with using Driving Time as a method for determining cycling speed, there are also limitations when using Walking Time, as there are some walking routes that are not suitable for bikes (or at least not suitable to travel at the average speed). See the Esri Community post: Custom travel mode - cycling travel time
Some recommendations to derive a suitable model for cycling time include:
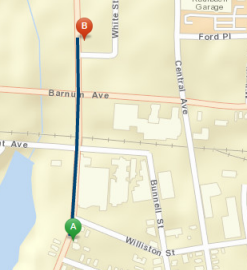
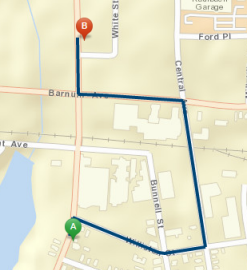
- Create polygons from both methods (driving and jogging) with the same speed applied and overlay them to compare the difference. If the differences are small, you can assume a pretty good model.
- Where the differences are large, you may have to make some assumptions, for example, you expect the cycle time to fall somewhere between the two distances.
- Understand your Area of Interest to determine if cyclists' riding patterns will behave more like cars or like pedestrians (for example, in the inner city or central business district, cyclists may behave more like cars, in the outer suburbs they may act more like joggers).
- Finally, if possible, perform your own testing in the field and compare how real-life data compares to the drivetime/jogging time polygons you created.
Article ID: 000033703
- ArcGIS Pro
- ArcGIS Online
- ArcGIS Enterprise
Get support with AI
Resolve your issue quickly with the Esri Support AI Chatbot.


Discover more on this topic
Search for related information
Find training related to this topic
Explore ideas and give feedback
Get help from ArcGIS experts
Start chatting now